The NASA Earth Observatory's Image of the Day for October 26, 2026 shows no distant galaxy and no dramatic storm. It shows leaves, painted across a world map in yellow and red, from Canada to China. The instrument behind that map was built to watch the ocean. It has turned out to be one of the best tools we have for watching vegetation, and scientists are counting on it for three very specific questions: when the seasons turn, where the carbon goes, and where fire is waiting.
The red wave swept the northern hemisphere in two weeks
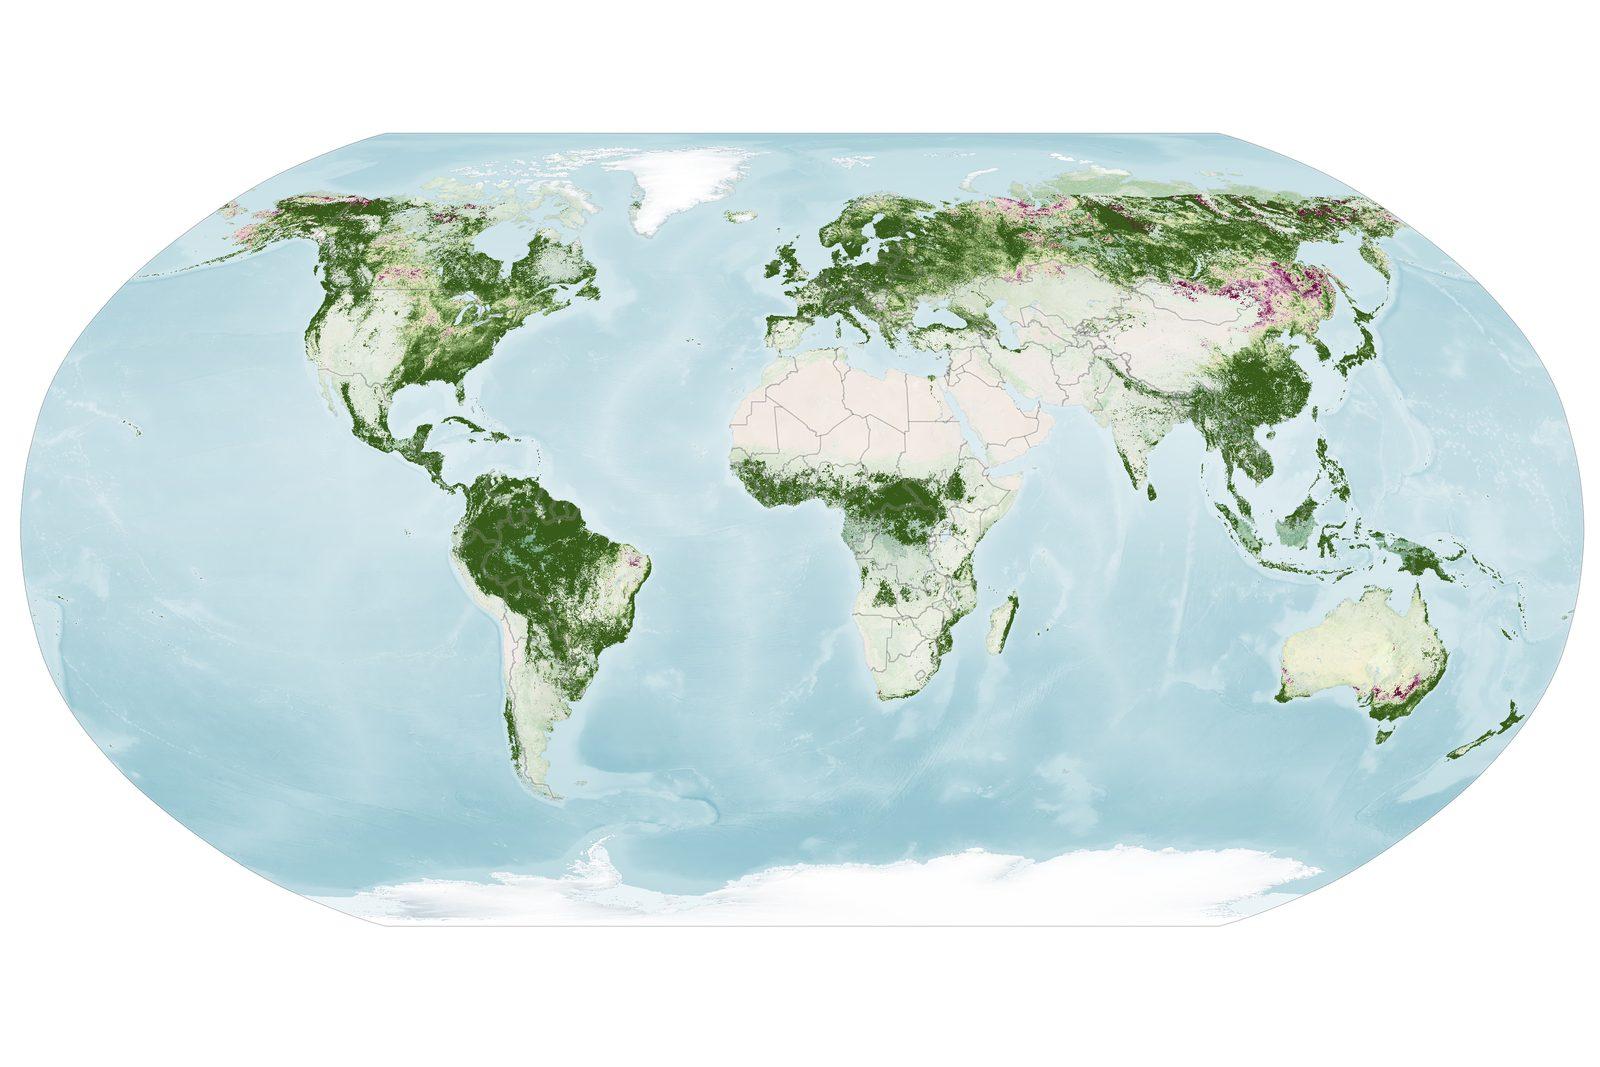
The first thing you notice on the two NASA Earth Observatory maps is how fast it moves. From September 29 to October 4, 2026, the deepest reds gather over New England, northern Canada, Alaska and northern Russia. The following week, October 5 to 11, they slide south. Red pushes into the central and eastern United States, Mongolia and northern China. In New England and upstate New York, the colour is already starting to fade.
These are not simple colour pictures. They plot a ratio: the red, orange and yellow light that leaves send back, divided by the green light. A patch that is still green returns a value close to 1, which means the satellite sees about as much red as green there. As the number climbs, autumn pigments take over from chlorophyll. The pale and red areas are foliage in mid-transition.
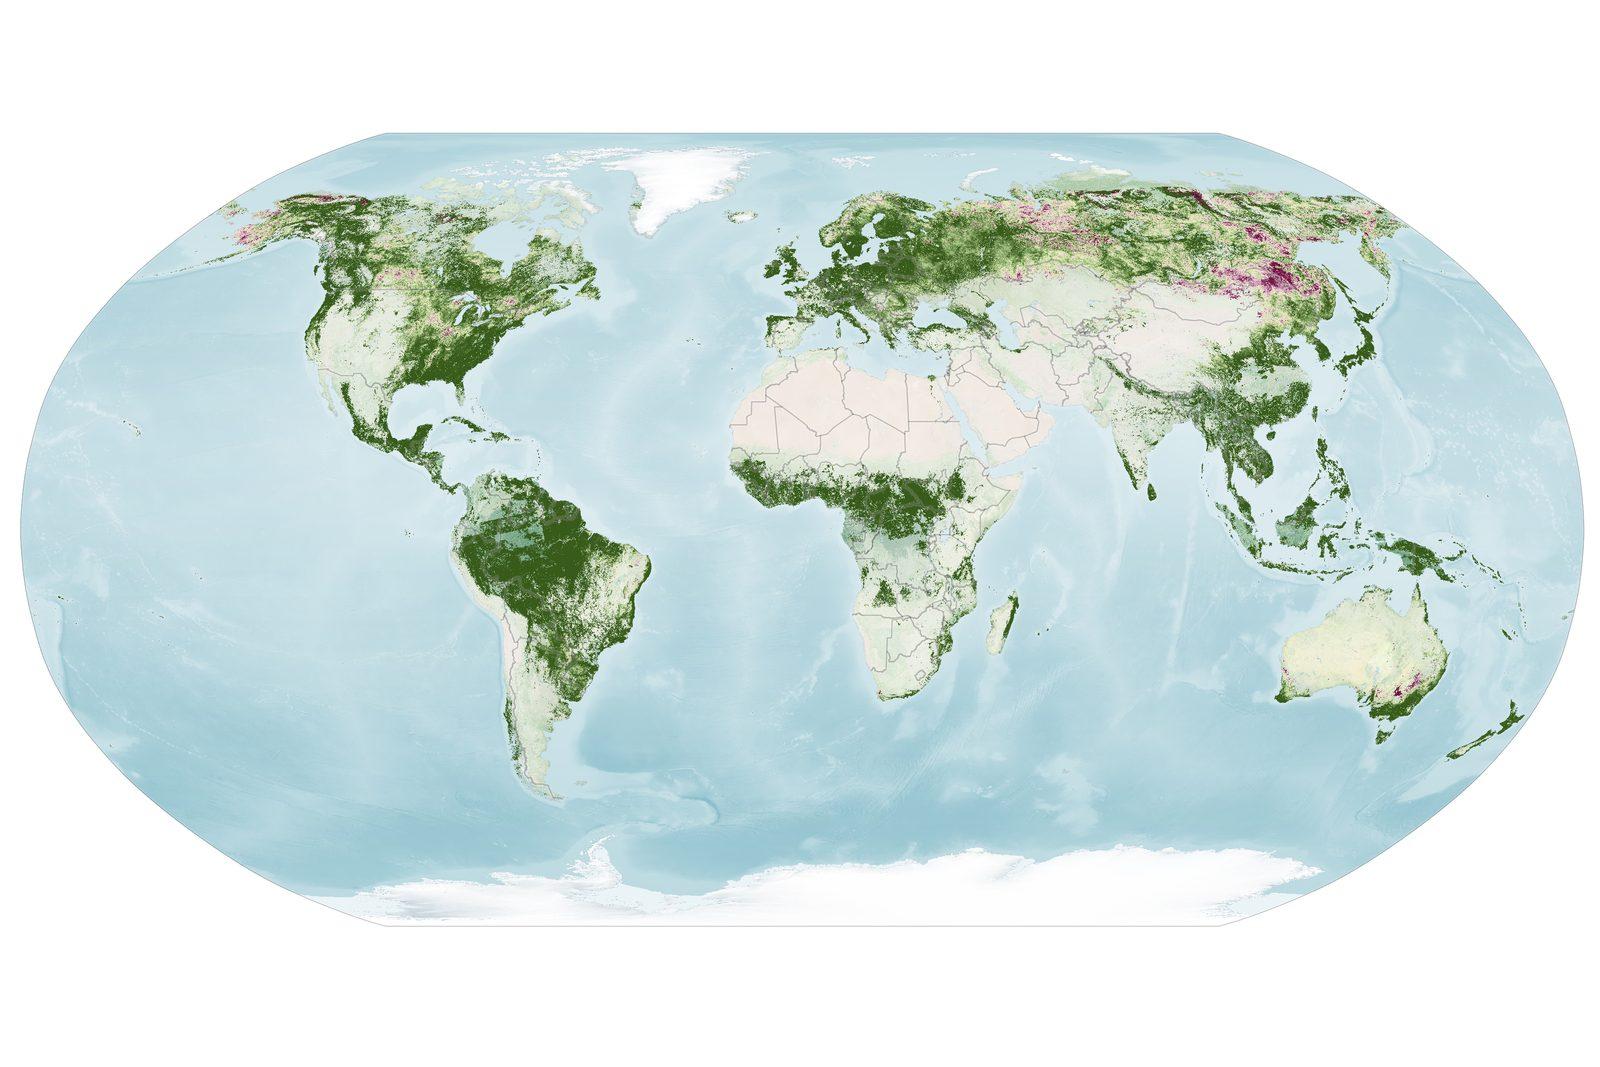
Geography explains the intensity. The reddest parts of eastern North America, the Adirondacks, Vermont's Green Mountains and New Hampshire's White Mountains, hold large stands of sugar maples and red maples. These broadleaf trees turn crimson within days. Further north, in the marshy tundra of Alaska, Canada and Russia, blueberries, bilberries, sedges, mosses and grasses add their own shades.
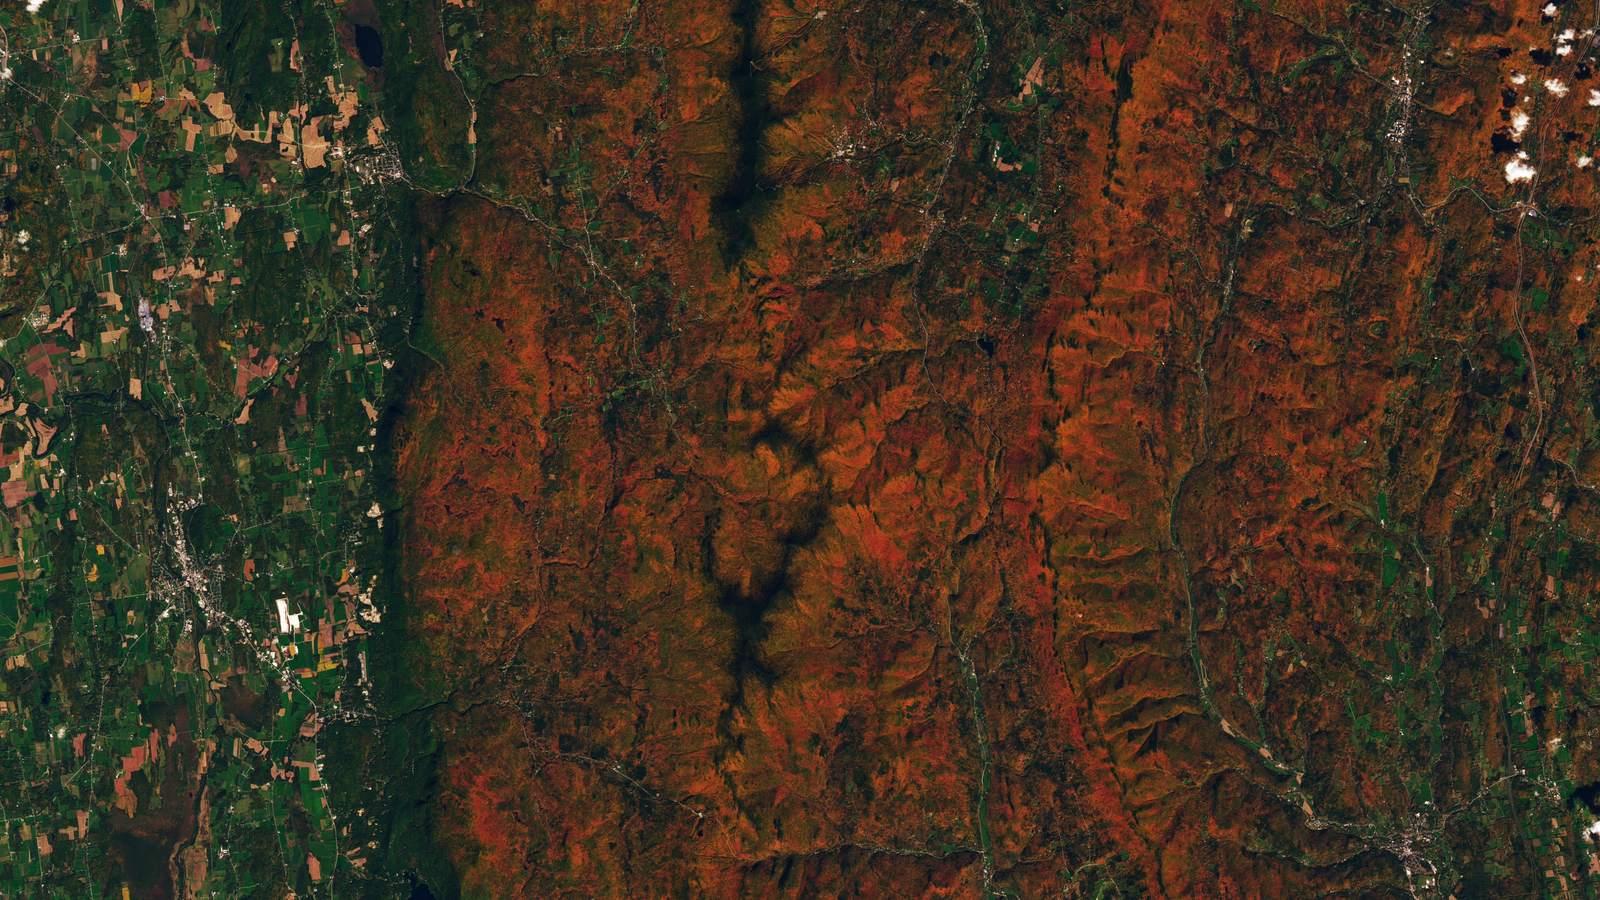
Our cover image shows the phenomenon up close. On October 3, 2026, the Operational Land Imager (OLI) aboard Landsat 9 photographed the forested ridges around Ripton, in central Vermont. Red and orange cover the high ground while the valleys stay green. The poet Robert Frost, who wrote "Nothing Gold Can Stay", kept a farm there and taught at the Bread Loaf School of English. A fitting echo for a phenomenon that satellites now measure in numbers.
Two caveats apply. Not every yellow or red patch is autumn foliage. In some farming regions, crops show high anthocyanin levels as they age or after harvest. And the white gaps that cut across the map come from clouds, not from missing vegetation.
286 wavelengths to read three pigments
The instrument is called OCI, for Ocean Color Instrument, and it flies on PACE, a NASA satellite launched in February 2024. The full mission name, Plankton, Aerosol, Cloud, ocean Ecosystem, sums up the original plan: plankton, aerosols, clouds and the ocean ecosystem. PACE was meant to study the sea. It studies land as well, and does it well.
Its strength lies in the way it cuts light apart. Where an ordinary camera keeps three colours, red, green and blue, OCI distinguishes 286. This is called hyperspectral measurement. Picture a piano with 286 keys instead of three notes, playing every shade of the spectrum. Each leaf pigment leaves a signature somewhere in those shades.
Three families of pigments tell the autumn story. Chlorophylls give the green and drive photosynthesis, the process that builds living matter out of light, water and carbon dioxide. Carotenoids give yellows and oranges. Anthocyanins give reds. In autumn, chlorophyll, an unstable molecule, is no longer renewed because there is less light and less warmth. Green fades and the other pigments show through.
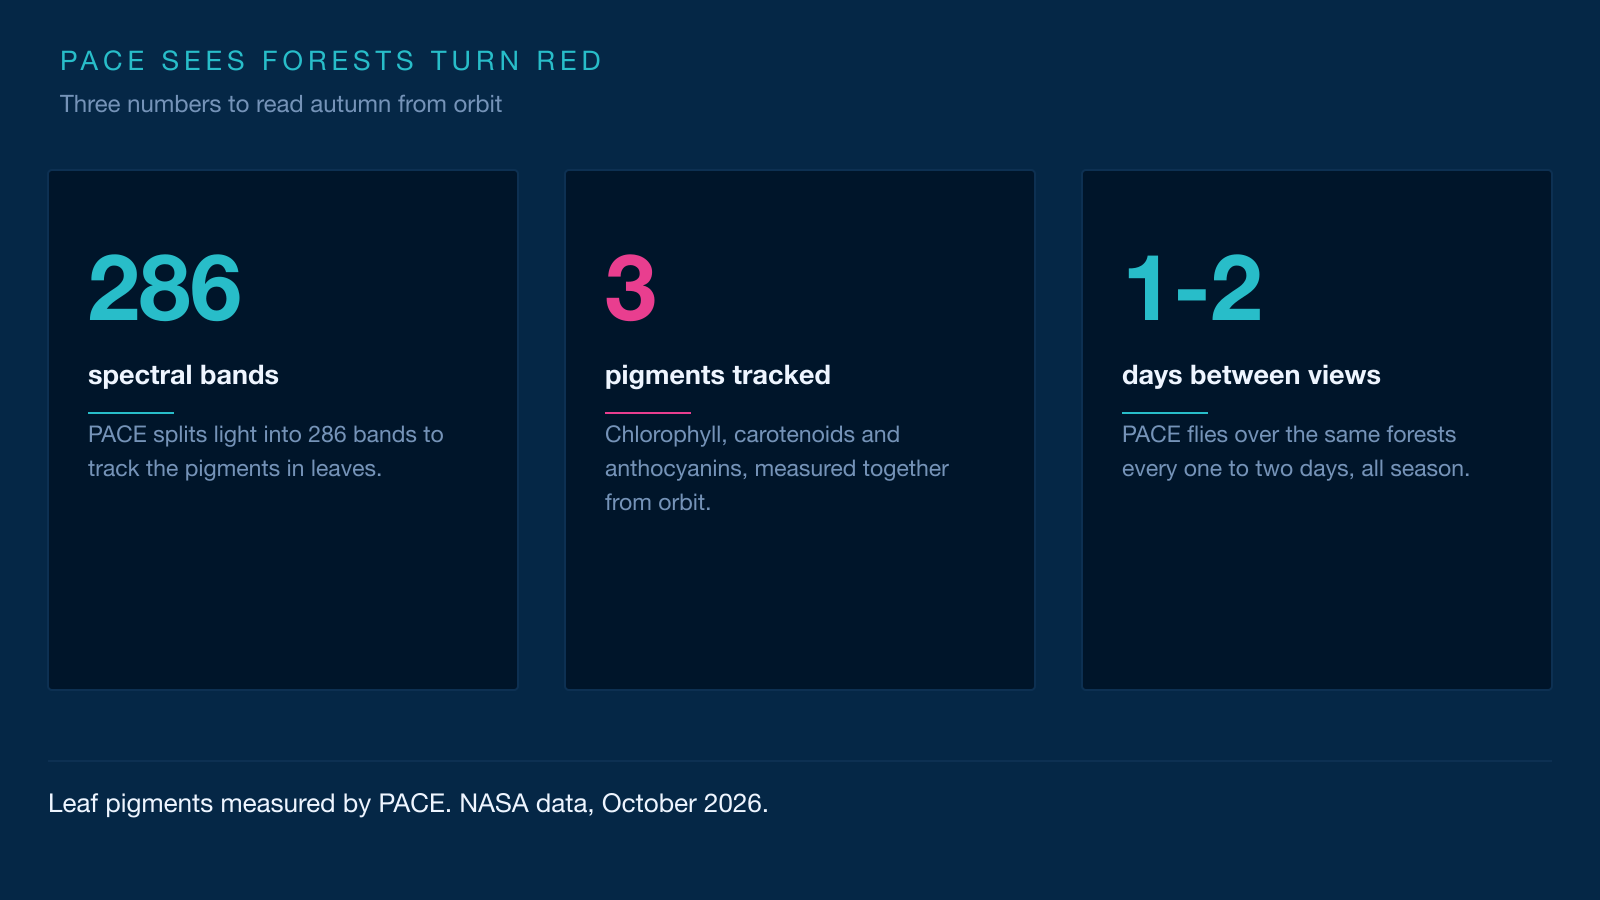
PACE is the first satellite able to measure all three pigments together, everywhere on the planet, nearly every day. Other hyperspectral satellites can do something similar, but over smaller areas and at longer intervals. That coverage changes what the data can do. "It's the ability to collect time-series data of anthocyanins and carotenoids everywhere on Earth repeatedly that is game-changing," says Karl Huemmrich, a vegetation scientist with the Goddard Earth Sciences Technology and Research II center at the University of Maryland, Baltimore County, and a member of the PACE science team.
Repetition is the decisive ingredient. A single snapshot shows red leaves. A series of snapshots shows when they turn red, how long they stay that way, and how the wave rolls towards the equator. Researchers can then pin down the date of peak redness and yellowness anywhere on the globe. "The time-series data allow us to determine peak redness and yellowness anywhere on Earth," Huemmrich adds. That date is what climate scientists are after.
The plant calendar is shifting, and PACE wants to time it
Spring is greening earlier. That is not an impression. A study by NASA and the National Park Service looked at 276 US national parks and compared first-leaf and first-flower dates over more than a century. About three quarters of the parks now see earlier springs. More than half have had springs classed as extreme, meaning among the earliest in a record that runs 112 years. In some places, such as the Grand Canyon, spring now arrives close to two weeks earlier than it did in 1901.
At the other end of the season, the phenomenon has a name. Autumn senescence is the point when a leaf stops building living matter, loses its colour and falls. That date is moving too. Warming can delay the first frosts and stretch the growing season in some regions, but the effect depends on species, soils and water supply. Researchers want to know by how much, and where.
The question is not a detail. The plant calendar sets the timetable for a whole crowd of animals. Pollinators arrive with the flowers, migratory birds with the insects, caribou with fresh plant growth. If spring runs ahead faster than the others can adapt, dinner is not ready when the guest arrives. Ecologists call this a phenological mismatch. Phenology is the study of those dates: flowering, leafing, migration and egg-laying.
PACE adds a piece that was missing. Classic greenness indices, such as the normalized difference vegetation index, or NDVI, mostly track how much green there is. They see a forest pale, not the exact shade of the season's end. The pigment indices from OCI separate yellowing from reddening and date the peak more precisely. Over several years, the series should show whether senescence is moving earlier or later, and how fast. The satellite has only two and a half years of record so far. That is little for a climate, and a lot for a world first.
Red marks the moment a forest stops storing carbon
A forest that greens up takes carbon dioxide out of the air. Photosynthesis combines that gas with water and light to build sugars, then wood, leaves and roots. Part of the carbon stays stored in the tissues of the tree. A forest that yellows and then drops its leaves stops or slows that pumping. Carbon then heads back to the atmosphere through the decay of dead leaves and the respiration of the soil.
That give and take is written into the CO2 curve measured at the Mauna Loa observatory in Hawaii since 1958. The curve rises year after year, but it also draws a sawtooth. Every spring, northern vegetation pulls CO2 out of the air and the concentration falls. Every autumn, growth stops, leaves fall, decay resumes, and the concentration climbs again. The northern hemisphere outweighs the southern one because it holds far more land and far more vegetation.
The stakes go well beyond temperate forests. Boreal forests, the vast belt of trees running across Canada, Scandinavia and Russia, store about 38 petagrams of carbon in their trees and 1,672 petagrams in their soils. A petagram is a billion metric tons. For scale, humanity burned about 11.14 petagrams of carbon in 2023. Boreal soils therefore hold roughly 150 times what humanity burned that year. The boreal forest accounts for about 20% of the global forest carbon sink, including 50% of all soil carbon, most of it locked in frozen ground. The biome has also warmed by about 2.5 °F over the past century.
The timing of senescence decides how long a forest stays a carbon sink. If leaves fall earlier, the pumping season shrinks. If autumn stays mild for longer, soil respiration keeps going and releases carbon while photosynthesis weakens. The balance depends on the ratio between the two, and that ratio changes from year to year. The series from PACE will date the switch more precisely than green colour alone ever could.
Fire joins the ledger. A blaze releases in days part of the carbon that took decades to pile up, and boreal soils can keep leaking afterwards. Arctic peatlands and permafrost together hold about twice as much carbon as the entire atmosphere. When they burn, that old carbon returns to the cycle, on top of the warming itself.
Dry leaves, and a fire risk written in the pigments
The link between colour and fire is no metaphor. A leaf that yellows and then browns loses water and becomes fine fuel, ready to burn. The moisture of living vegetation, what fire managers call fuel moisture, decides how easily a spark becomes a wildfire. The drier the leaves, the higher the risk.
Pigments record that state. OCI measures plant health, stress levels, drought and the balance between pigments. That information helps pinpoint the places at high risk of fire, and land managers can use it to place prevention resources. NASA lists this among the direct applications of PACE data, alongside mapping burned areas and tracking smoke.
Red itself can be a signal. "Changes in pigments can also occur when vegetation is stressed due to drought or insect damage," says Skye Caplan, a data scientist at NASA who leads the land side of PACE. She notes that such changes probably explain the high redness recorded in farming regions of Brazil, Australia and Canada, which do not follow the general seasonal calendar.
Some caution is in order. A redness map is not a fire forecast. It describes the state of vegetation, not a spark. Crops, bare soil and clouds can all muddy the reading. That is exactly why ground observations matter, and why the PACE team asks volunteers for photos.
The risk takes on a different scale in the far north. Researchers there see fires starting in late March, far earlier than in the records, and still burning after the first snows. Some fires smoulder underground all winter in peat, the so-called zombie fires, then surface in spring. Satellites form the backbone of that monitoring, with a quarter century of fire data behind them.
Your photos can serve as a ground check
A satellite sees the colour of a forest, not a leaf. It measures light bounced back by a mix of trees, soil, crops and clouds. Turning that signal into reliable information takes observations made on the ground, at the same place and the same time. That is the job of the GLOBE Program, short for Global Learning and Observations to Benefit the Environment, an international network of students, teachers and volunteers.
GLOBE's North American phenology campaign runs from August to December in autumn and from February to June in spring. There are two ways to take part. The first is to follow the Green-Down protocol on one chosen tree, noting leaf colour and leaf fall twice a week. The second is to photograph a landscape with the Land Cover tool in the GLOBE Observer app, aiming up, down and towards the four cardinal directions, then adding a shot of the patch where the colours are most striking.
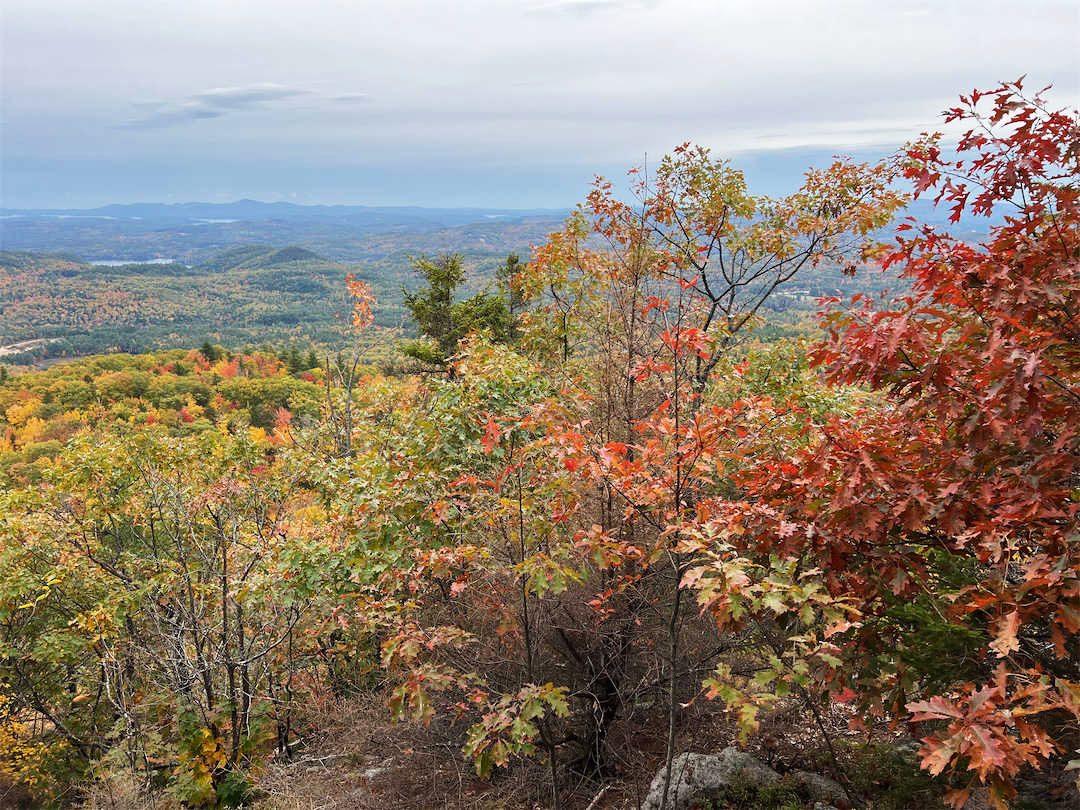
These observations check the colour indices from PACE. They also help researchers understand why two forests at the same latitude do not change at the same time. Caplan publishes redness maps every week, and those maps show the wave leaving the high latitudes in August before moving towards the equator in September and October. Public photos let that advance be compared with what is actually happening on the ground.
You do not need to live near a spectacular forest. Scientists also want observations of shrubs, grasses, wildflowers, conifers and crops. And if you are following one tree, do not wait too long. "Color changes happen kind of slowly, then all at once, and then they're gone," Caplan sums up. The campaign is free and open to anyone. All it takes is an account on the GLOBE website.
Going further
- Track the planet from orbit: our live Earth page gathers the indicators measured by satellite, and the observing guide explains what you are looking at.
- PACE watches the ocean too. Our article on El Niño 2026 and the satellites measuring it shows how the same instrument follows the colour of the sea.
- The ideas behind this story: the atmosphere, which carries heat and moisture, the Earth orbit, which sets the rhythm of the seasons, and NASA, which runs PACE and Landsat 9.
- Earth observation does not only come from dedicated satellites. The International Space Station also carries instruments pointed at the ground, such as OCO-3, which measures carbon dioxide above cities and forests.
- Sources for this story: NASA Earth Observatory's report on hunting red leaves with satellites, which documents the maps, the pigments and the GLOBE campaign.