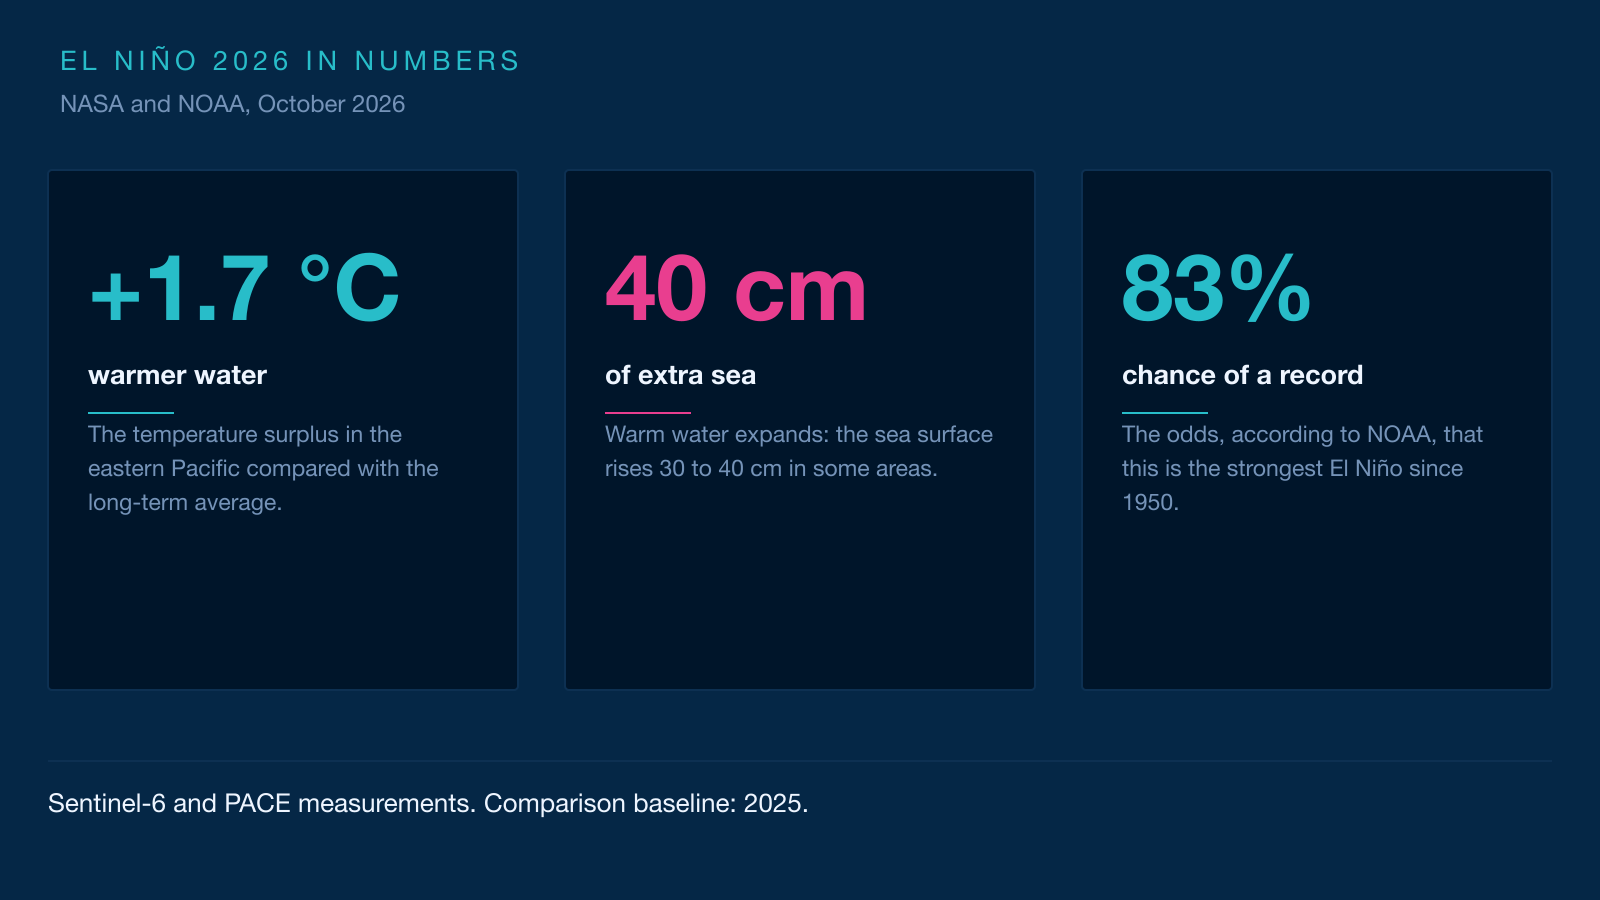
This autumn, a phenomenon rarer than a solar eclipse and more powerful than any single storm is playing out across the Pacific. It is called El Niño. In October 2026, NOAA, the US ocean and atmosphere agency, put an 83% chance on it being the strongest since 1950. Two NASA satellites are tracking it to the centimetre: Sentinel-6 for the height of the sea, PACE for the colour of the water. Here is what they see.
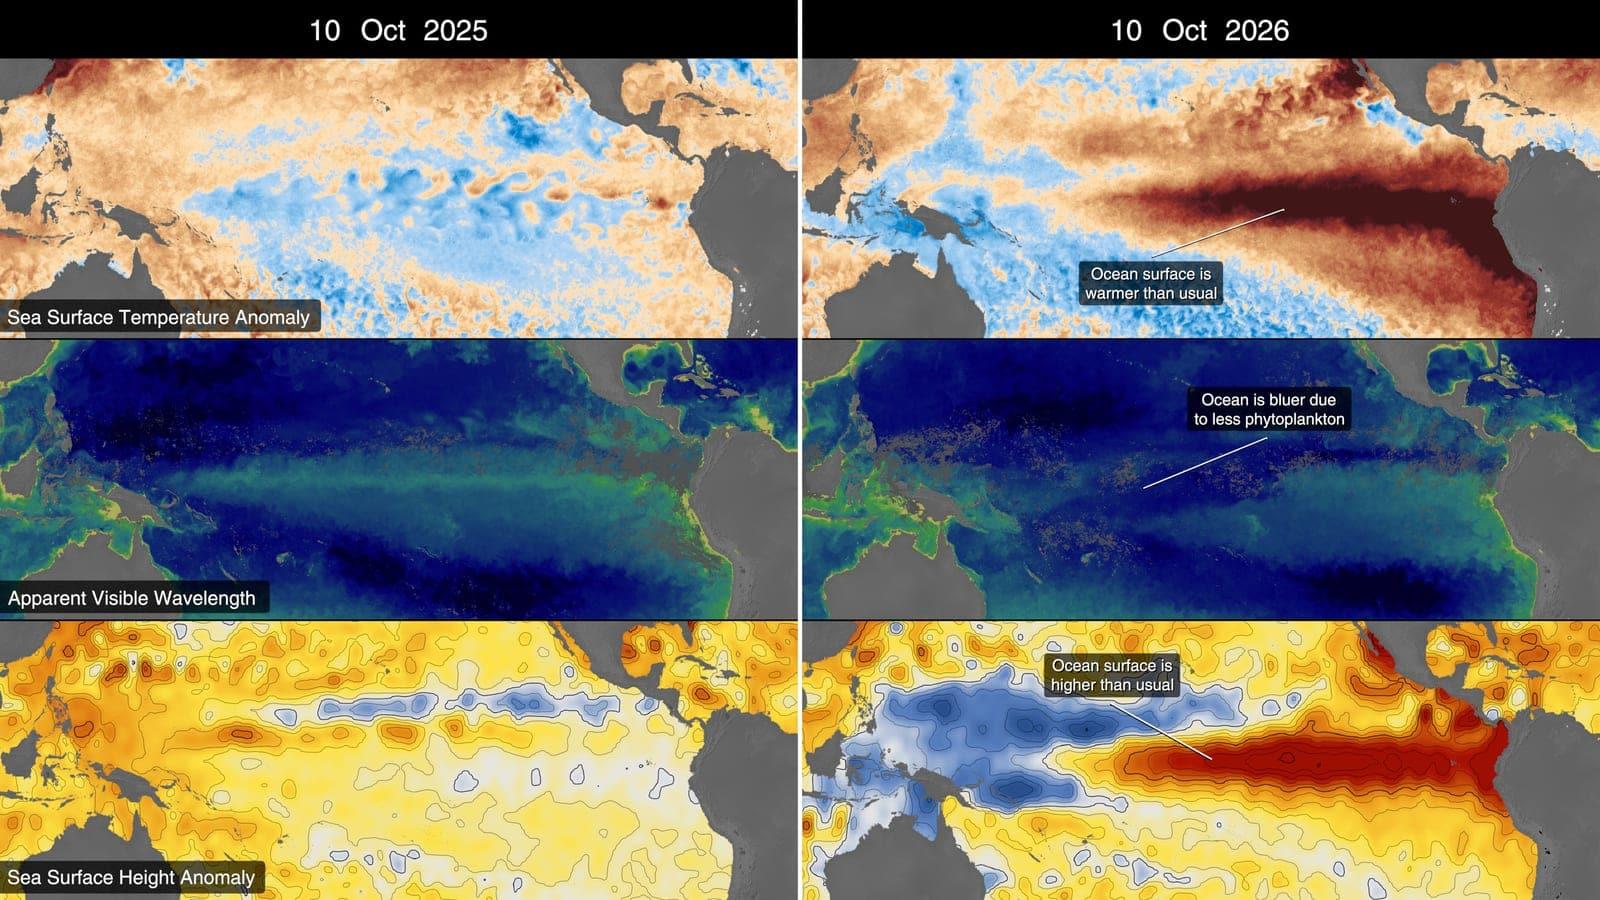
A sea 1.7 °C warmer and 40 cm higher
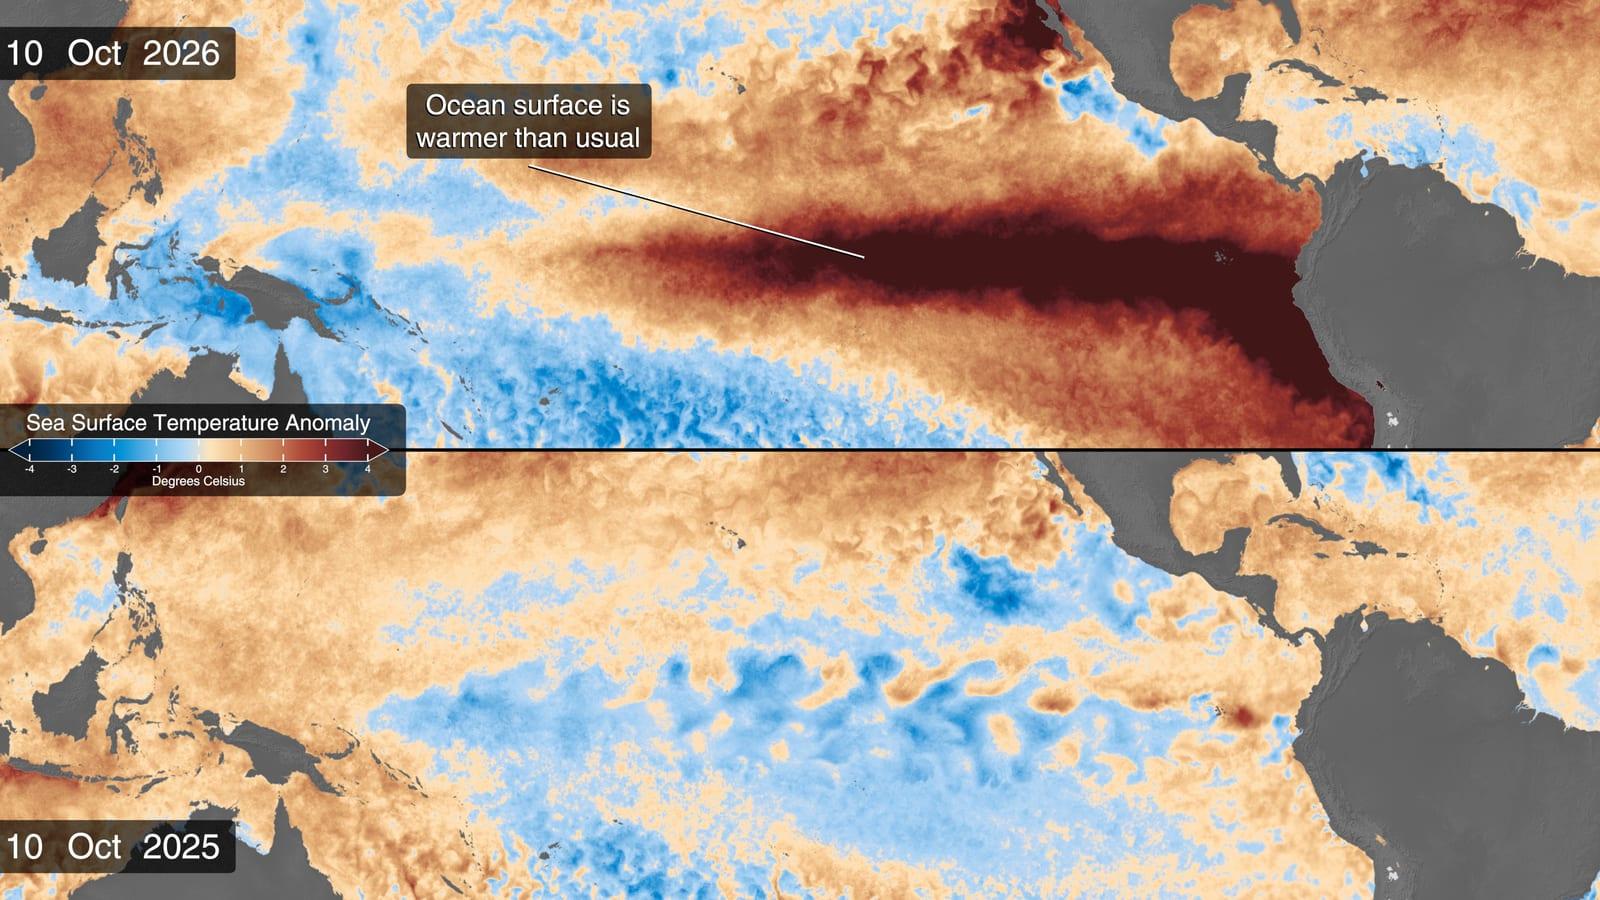
Start with the figure that says the most. In the eastern Pacific, sea surface temperatures sit roughly 1.7 °C above the long-term average. That average is built from decades of measurements, and it is what any given reading is compared against. A rise of 1.7 °C sounds modest for a swim. Scale it to an ocean and it becomes enormous: you are heating millions of square kilometres of water, tens of metres deep.
That warming has a counter-intuitive consequence, and Sentinel-6 measures it directly. Warm water takes up more space than cold water, so it expands. When a body of water heats up, it swells and its surface lifts locally. As a result, sea level across parts of the eastern Pacific climbs 30 to 40 centimetres above normal. The satellite measures that height, not the temperature: an indirect but remarkably precise way of weighing the heat stored in the ocean.
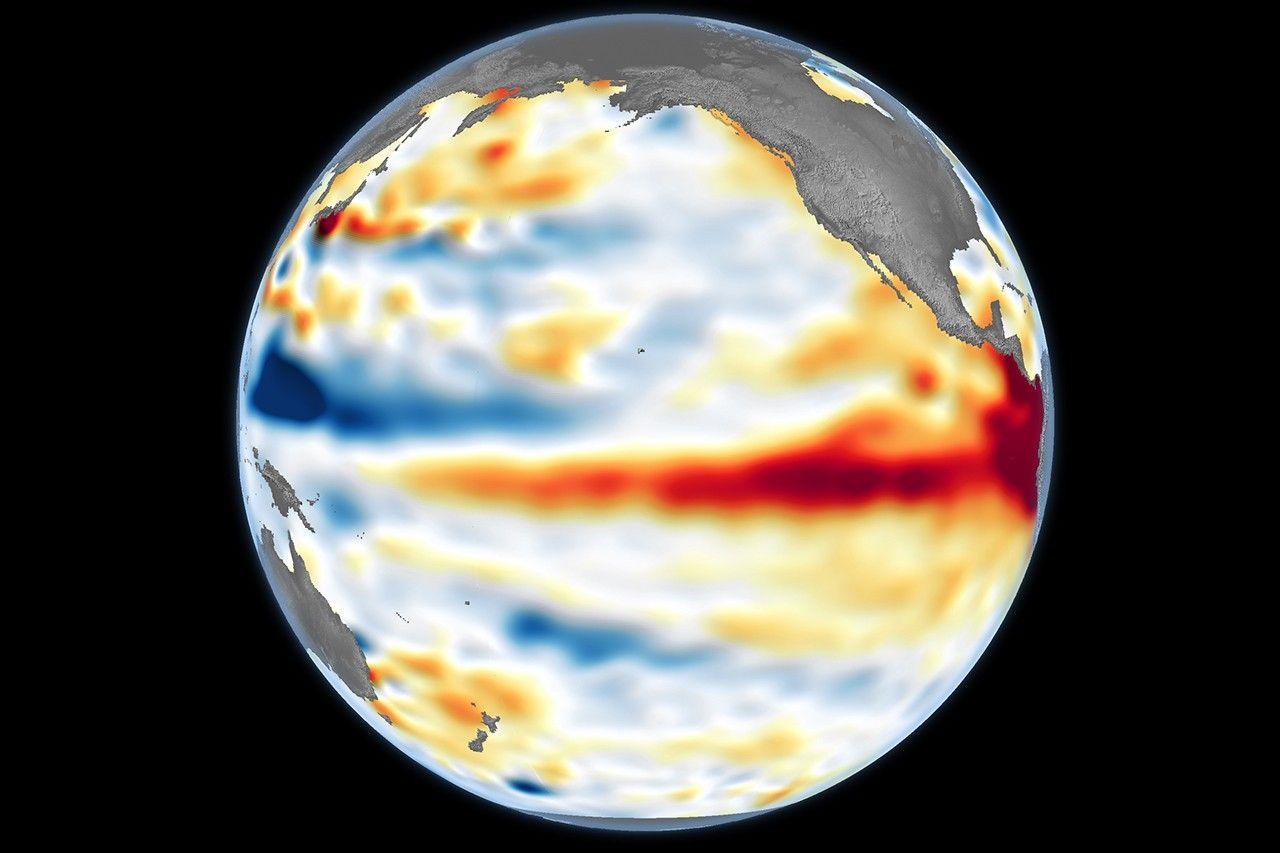
The mechanism is visible to the eye in the maps from early this year. A bulge of warm water, called a Kelvin wave, sets off from the western Pacific and crosses the ocean from west to east. These waves are pulses of water thousands of miles long, drifting slowly forward. "Kelvin waves are like the heartbeat of El Niño," says Josh Willis, project scientist for sea level missions at NASA's Jet Propulsion Laboratory in Southern California. And our sea level satellites let us peer into the ocean and watch every beat.
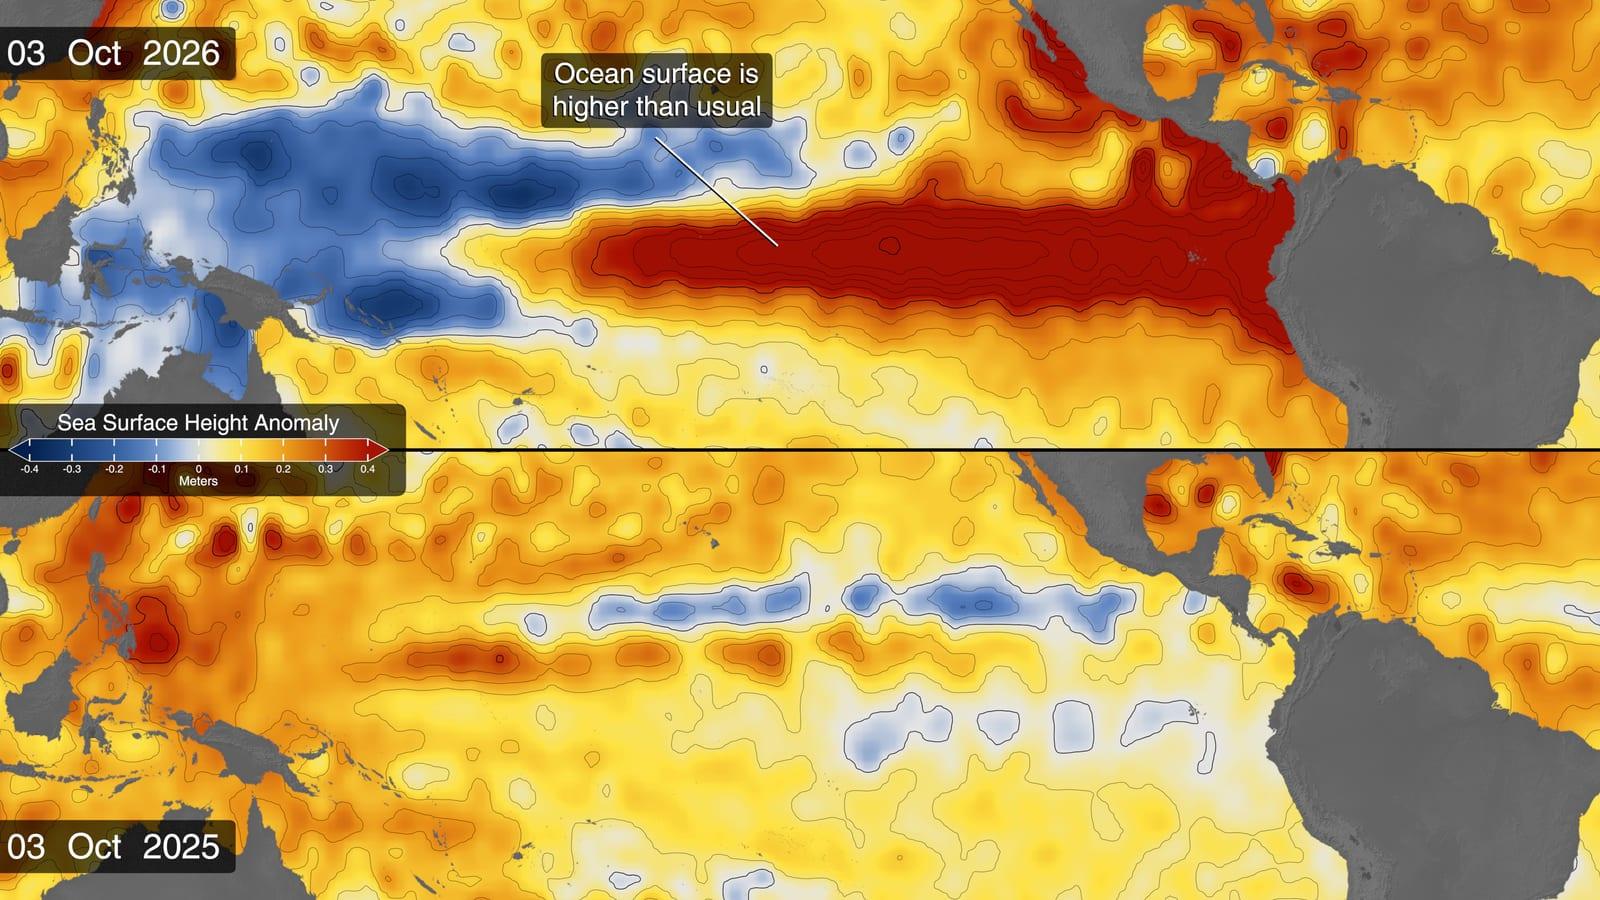
It all began in January 2026, when the first Kelvin wave was spotted near Micronesia, in the western Pacific. By early April those waves had reached the eastern basin and surface temperatures had started to climb. The warm water spread toward South America, then moved up the coast toward California. At the far end of the basin, around Indonesia and northern Australia, the sea instead ran 15 to 20 centimetres below normal.
The sequence matters because it feeds on itself. Warm water heats the air directly above it, and that air rises. The rising air reshapes pressure patterns and weakens the trade winds, the steady winds that normally blow from the Americas toward Asia. Weaker winds mean less water pushed west, so the eastern Pacific rises further and warms further. That loop is the tipping point that locks an El Niño in place.
PACE watches the ocean change colour
The second witness looks at something else entirely. Launched in February 2024, the PACE satellite carries an instrument that splits light coming off the ocean into several hundred different wavelengths. This is what scientists call a hyperspectral measurement: where a camera captures three colours, this instrument separates hundreds. That is how it picks up shades the eye could never resolve.
Those shades tell the story of microscopic ocean life. Phytoplankton, a catch-all name for tiny plants drifting in the water, form the base of the marine food web. Thousands of species exist, ranging from teal to brown to green. When they are abundant, the sea turns green. When they thin out, it turns bluer.
That is precisely what PACE is recording in 2026. The green band along the equator in the western Pacific, normally steady, is shrinking. A bluer shade is spreading in its place. Researchers boil those hundreds of wavelengths down to a single number, the apparent visible wavelength, which describes the average colour of the ocean. A shift toward blue means water that is poorer in phytoplankton.
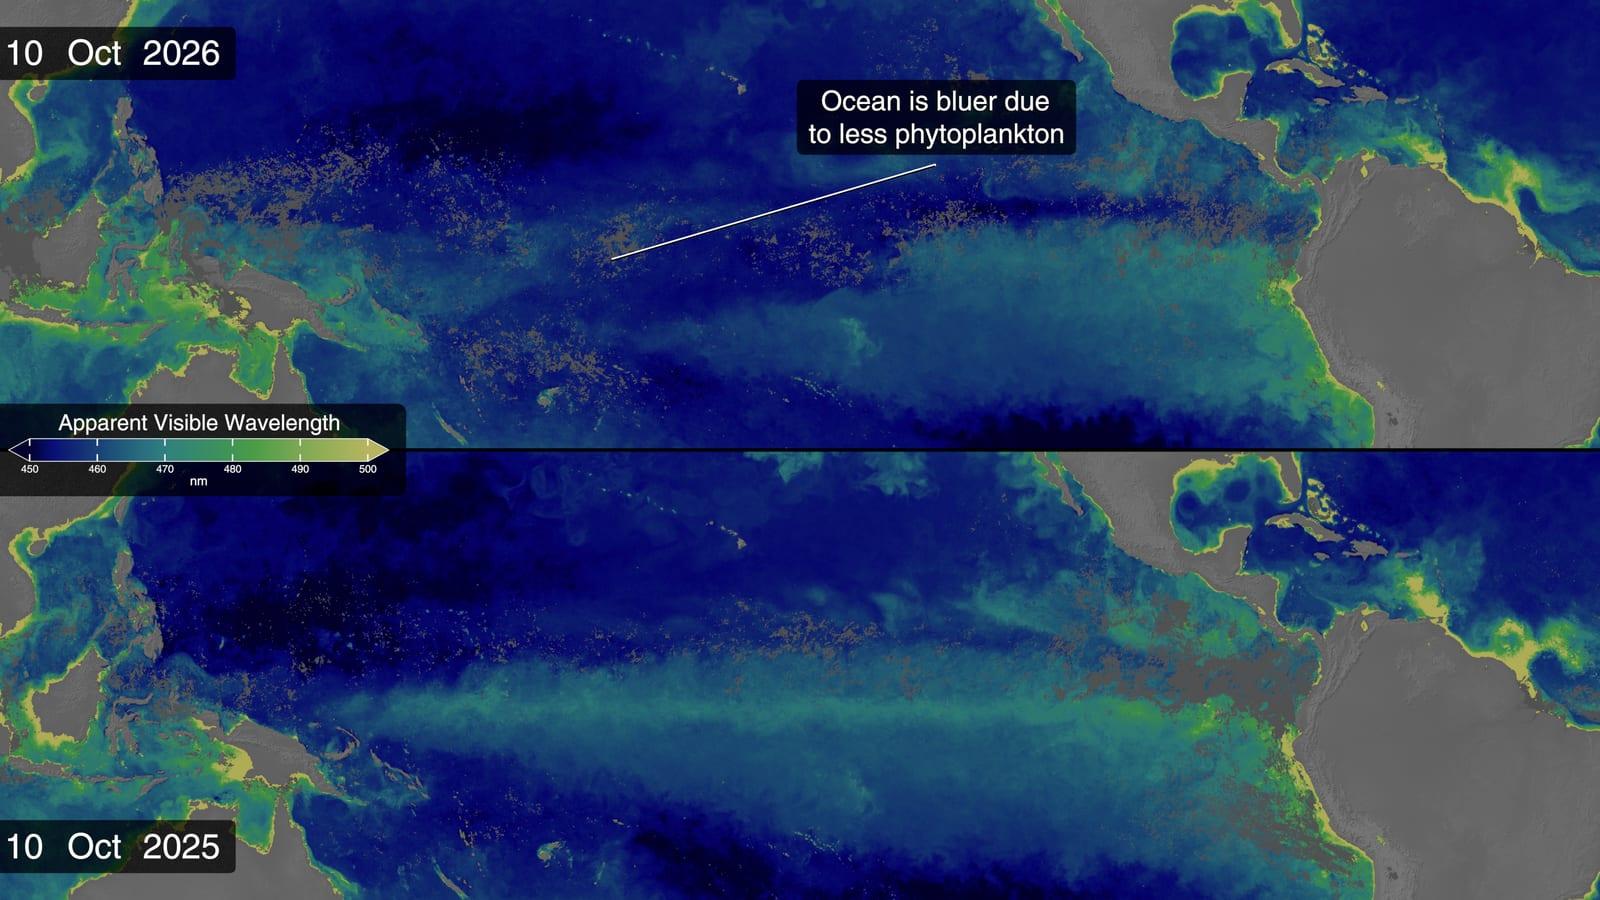
The reason comes down to food. Phytoplankton thrive in cool, nutrient-rich water. Those nutrients come from the deep, carried to the surface by currents known as upwelling. During an El Niño, the trade winds weaken and the warm surface layer thickens. That warm layer acts like a lid: cold water stops rising, and the nutrient supply stops with it.
Cut off from food, phytoplankton decline. The consequences reach well past the colour of the sea. The entire food web rests on them: less phytoplankton means less zooplankton, fewer small fish, and predators forced to relocate to new hunting grounds. Fishers notice before the models do, because fish shoals follow their food.
What this tracking changes going forward
There is a specific reason 2026 stands out in the records. It is the first complete El Niño that PACE has observed since its 2024 launch. Earlier events were tracked with blunter instruments that resolved only a handful of colour bands. PACE sees several hundred, and it passes over every region almost daily.
Comparing with the past therefore becomes possible at a level of detail never available before. Researchers already hold a continuous sea level record going back to 1993, now extended by Sentinel-6, which sweeps the entire ocean every ten days down to a few millimetres. PACE supplies the other half: colour, and with it, life. Two complementary views of the same phenomenon.
What is the point of these data? First, understanding. El Niño redistributes ocean heat and scrambles rainfall across the planet, bringing drought in some places and floods in others. Tracking it better means anticipating those effects better for farmers, firefighters and coastal communities, as NASA points out. Second, measuring. Every event documented in detail sharpens the models used to forecast the next one.
One unknown remains, and scientists are upfront about it. Whether 2026 will eclipse 1997, one of the most powerful events on record, depends on what the ocean does in the coming weeks. In June, conditions in the western Pacific resembled 1997 at the same date, but the east lagged behind. More warm Kelvin waves were on the way. NOAA expects the event to keep strengthening through the end of 2026.
A satellite does not predict the future, it photographs it as it unfolds. What Sentinel-6 and PACE provide is a detailed chronicle of a phenomenon that touches almost everyone, every time it occurs. As Josh Willis puts it: many have seen what El Niño can do, we look to the ocean to understand why.
Further reading
- Explore the planet from orbit with our tools: live Earth status and the observing guide.
- Useful definitions for following this phenomenon: atmosphere, Earth orbit, NASA and ESA.
- Other watchful eyes to compare: the International Space Station, which observes Earth from 400 km up, and Tiangong, the Chinese station, which also carries Earth-observing instruments.
- Sources for this article: NASA's article on the 2026 El Niño, NOAA's explanation of El Niño and the Scientific Visualization Studio gallery.
- Your best images of the sky and Earth: share them in our astrophotography gallery.