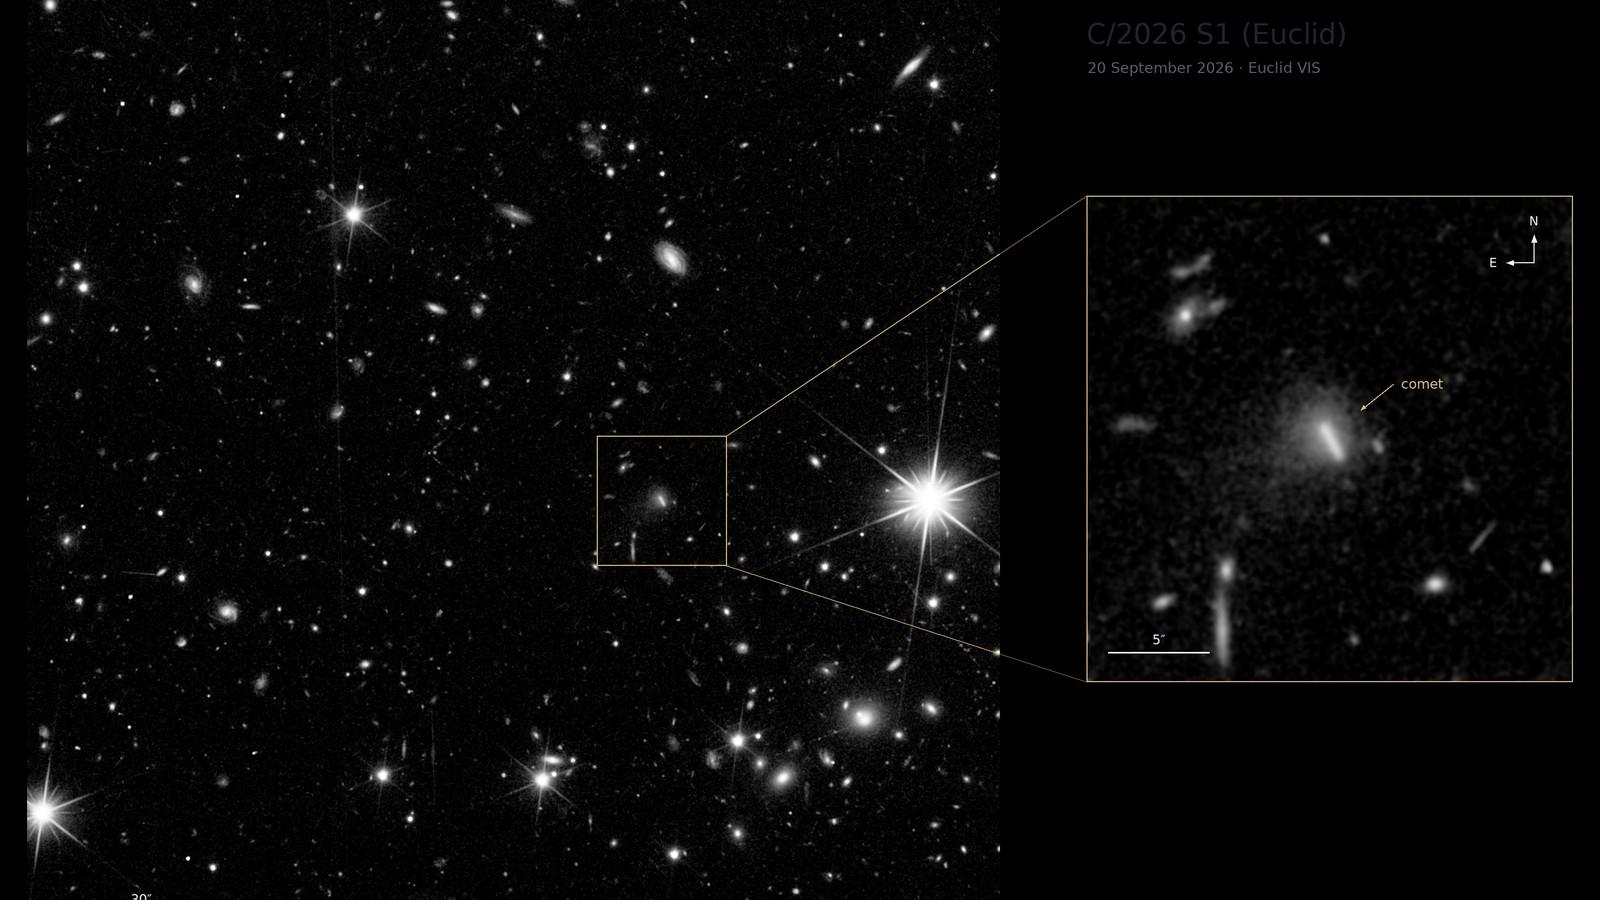
On 12 November 2026, ESA released DR1-Foundation, the first major data batch from its Euclid mission. The haul captures the light of more than a billion objects, including 900 million galaxies, across a patch of sky equal to 9,500 full Moons. It is the first stone of its largest-ever 3D map of the Universe. Here is what the file contains, and how a picture becomes a distance.
A billion objects over 1,900 square degrees
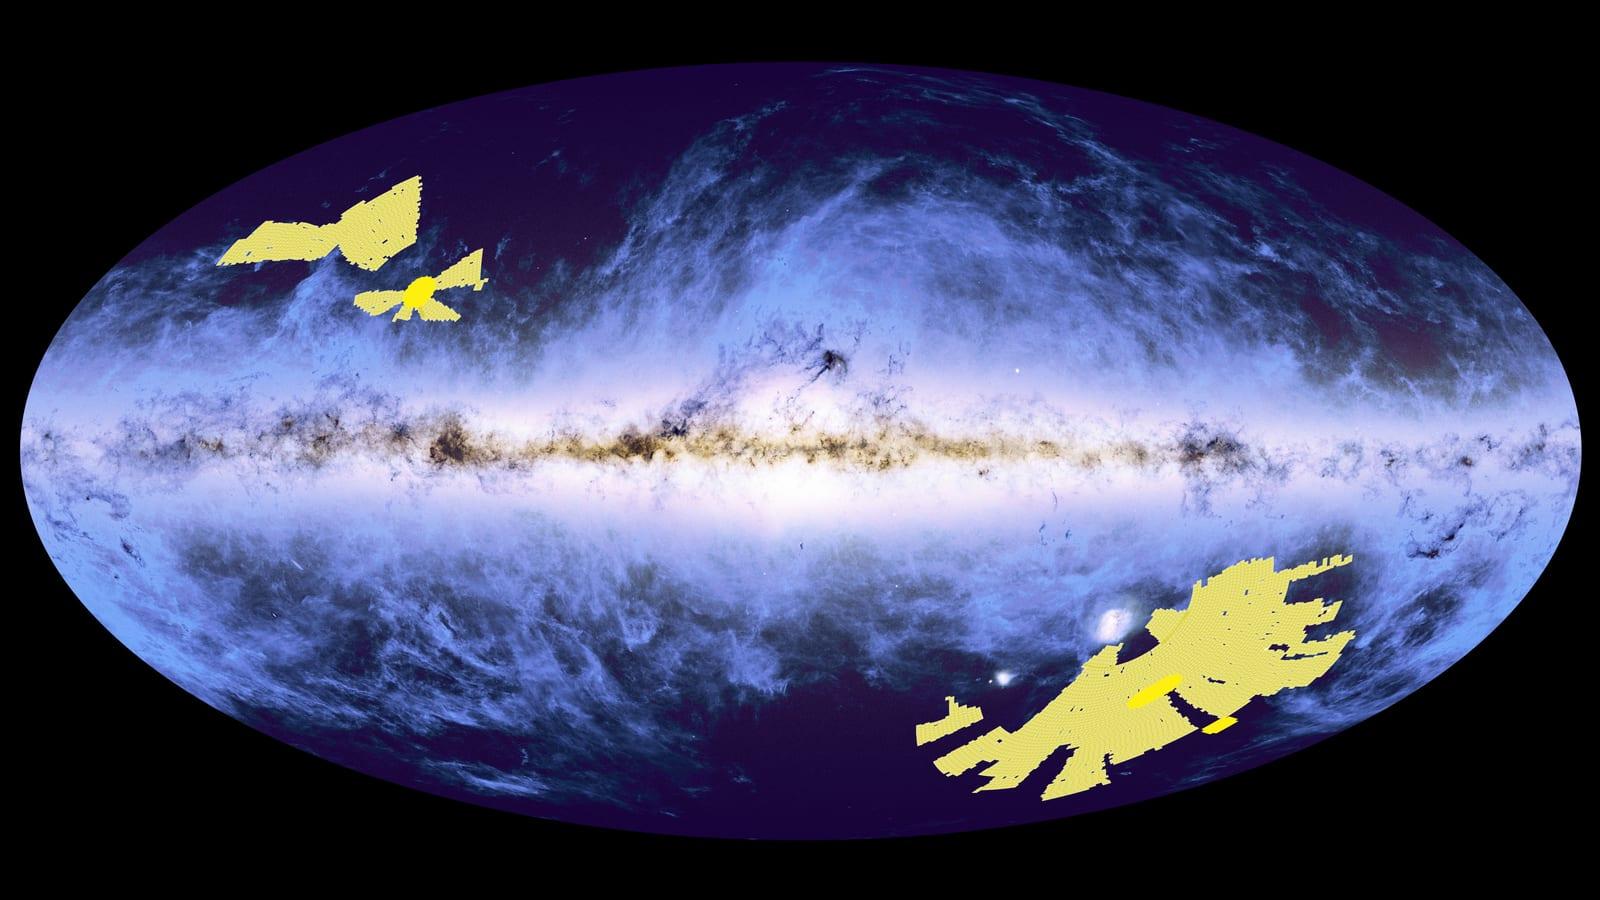
The number is dizzying, so it helps to break it down. DR1-Foundation rests on about 13 months of observations, gathered from spring 2024 to spring 2025. The area covered reaches 1,900 square degrees. A square degree is a square one degree wide on each side on the celestial sphere. The clearest yardstick for 1,900 square degrees is the Moon: the surveyed area equals 9,500 times its disc.
Within that footprint, Euclid recorded more than 900 million galaxies. The release also holds more than 60 million quasar candidates, the bright cores of distant galaxies, and the spectra of more than 160 million sources. The total passes a billion objects because it also counts stars and quasars, not just galaxies. The data volume reaches 1.7 million gigabytes, or 1,700 terabytes.
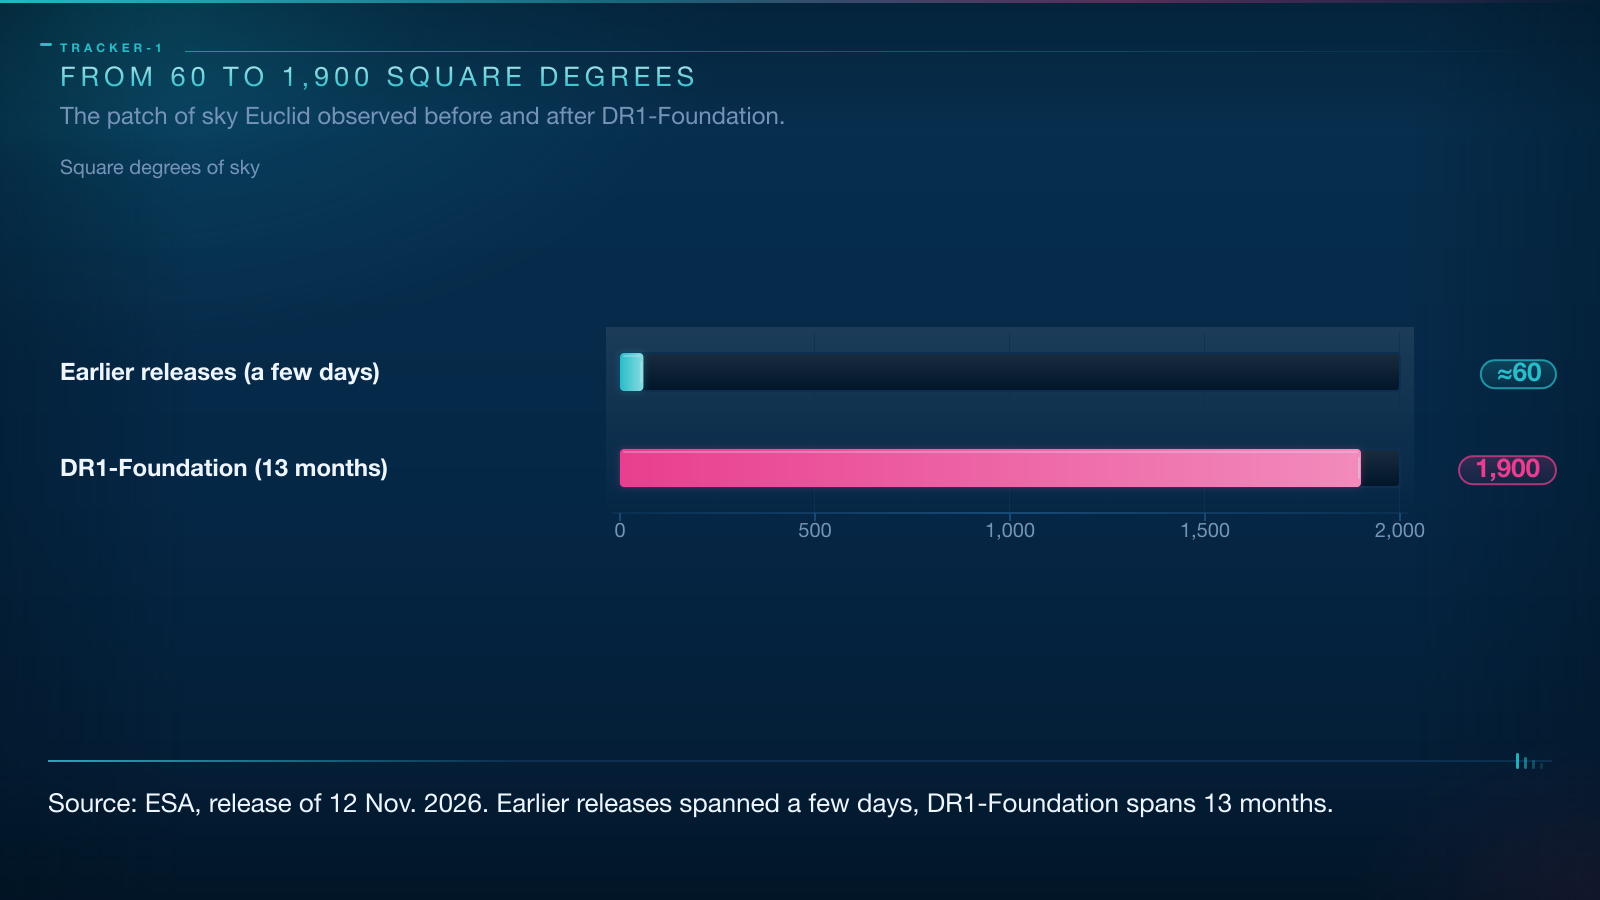
To grasp the jump, compare it with earlier releases. Euclid's first publications covered a few days of observations and around 60 square degrees. DR1-Foundation covers 1,900. Divide one by the other and you get about 32 times more sky at once. This is only the beginning. The full survey is meant to run for six years. The current release represents about 14% of the area Euclid must scan, and the complete DR1 is due on 16 June 2027.
How Euclid turns light into a 3D map
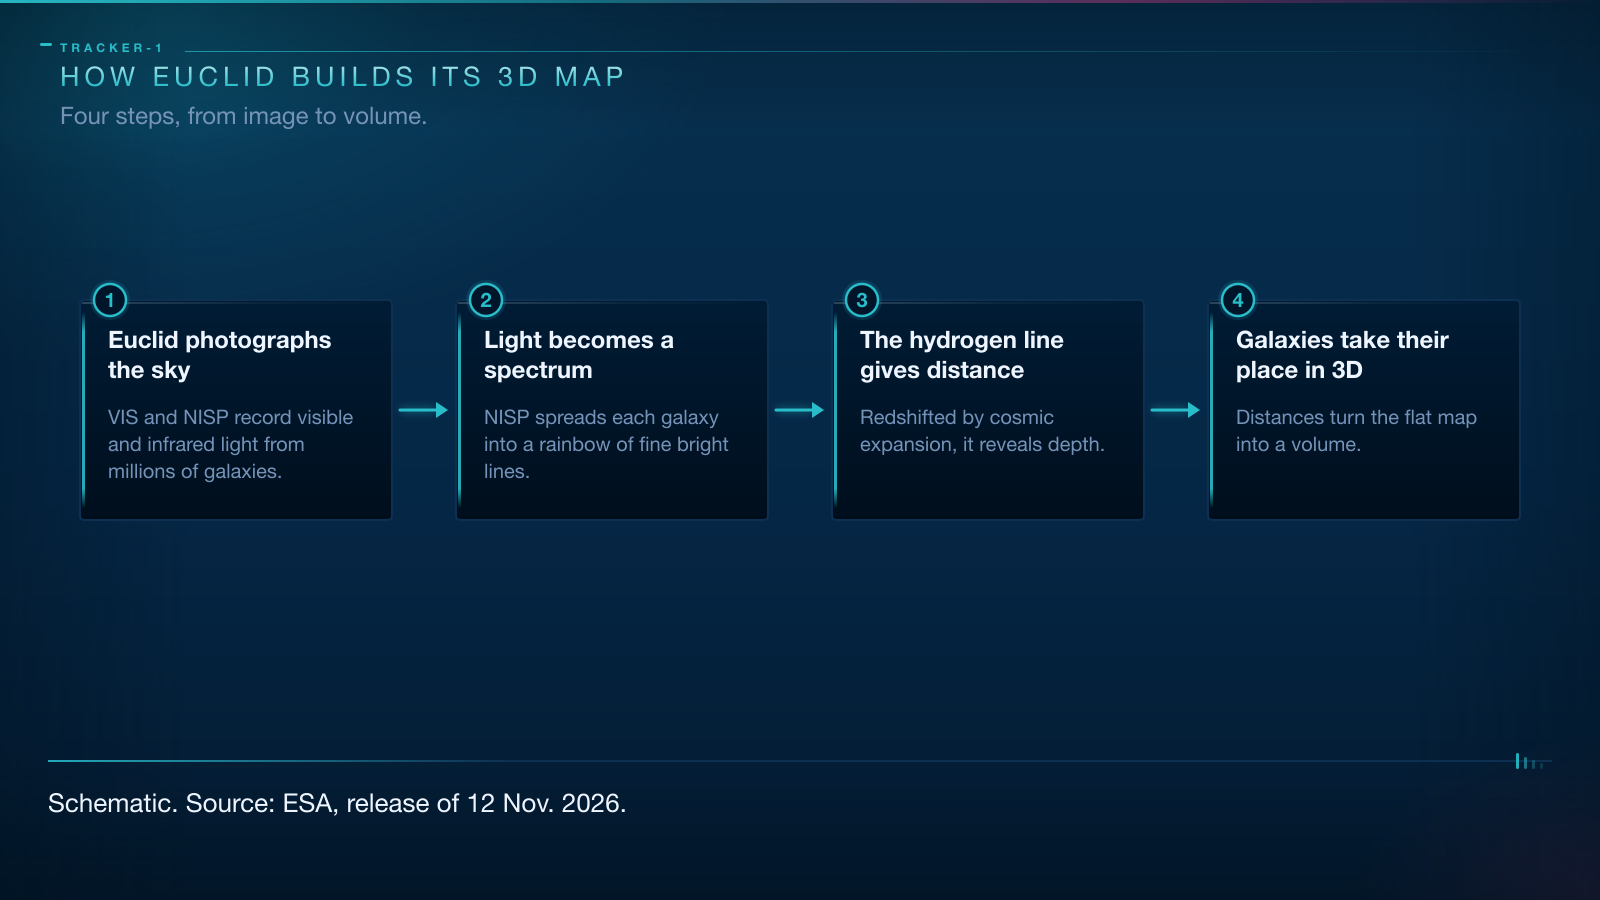
An image gives only two dimensions. It places each galaxy on the celestial sphere, like a flat map. Depth requires distance. And for distance, Euclid relies on spectroscopy.
The principle comes from the expansion of the Universe. The farther away a galaxy is, the longer its light has travelled, and the more the expansion has stretched it. The bright lines produced by the galaxy's gases shift toward the red. Astronomers call this shift redshift. It works a little like hearing a truck's siren fade as it drives away: the sound drops. For light, the lower pitch is a redder colour.
Euclid does not chase just any line. It hunts hydrogen-alpha, the light emitted by the gas clouds where stars are born. Its NISP instrument, short for Near-Infrared Spectrometer and Photometer, splits the infrared light of galaxies into spectra. Each spectrum is a thin rainbow, with bright lines at precise positions. By locating the hydrogen line and measuring its shift, researchers obtain the distance.
This is where the 160 million spectra matter. Each spectrum is a potential distance. Once distances are known, galaxies stop being dots on a flat map. They take their place in a volume, hundreds of millions or billions of light-years away. The result is a 3D map of the Universe's structure, with its filaments and its voids.
Euclid observes from the L2 Lagrange point, 1.5 million kilometres from Earth. Its 1.2 m telescope feeds two instruments. VIS, the visible instrument, takes very sharp images. NISP works in the infrared and delivers the spectra. The Euclid mission launched on 1 July 2023 and began routine science observations on 14 February 2024.
15,000 lenses to weigh dark matter
A massive galaxy can bend light. When a foreground galaxy lines up with a more distant one, its gravity acts as a magnifying glass. The background galaxy stretches into an arc, sometimes a ring. This is strong gravitational lensing. The effect is rare: only one galaxy in several thousand plays that role.
DR1-Foundation holds around 15,000 candidates. That is the largest strong lens catalogue ever assembled, bigger than all previous catalogues combined. The leap is not only about quantity. Until now, astronomers studied lenses one at a time, as curiosities. With 15,000 systems, they can study a population. Almost fifty years after the first strong lens was found, the field changes scale.
The payoff is direct. The shape of the arc depends on the total mass of the foreground galaxy, stars and dark matter included. Measuring the arc therefore weighs the dark matter. Natalie Lines of the University of Portsmouth, a member of the Euclid Consortium, explains that strong lenses make it possible to weigh individual galaxies, dark matter included, and to probe the expansion of the Universe. The method also tests that expansion, because the distance of the lens and the distance of the background galaxies both enter the calculation.
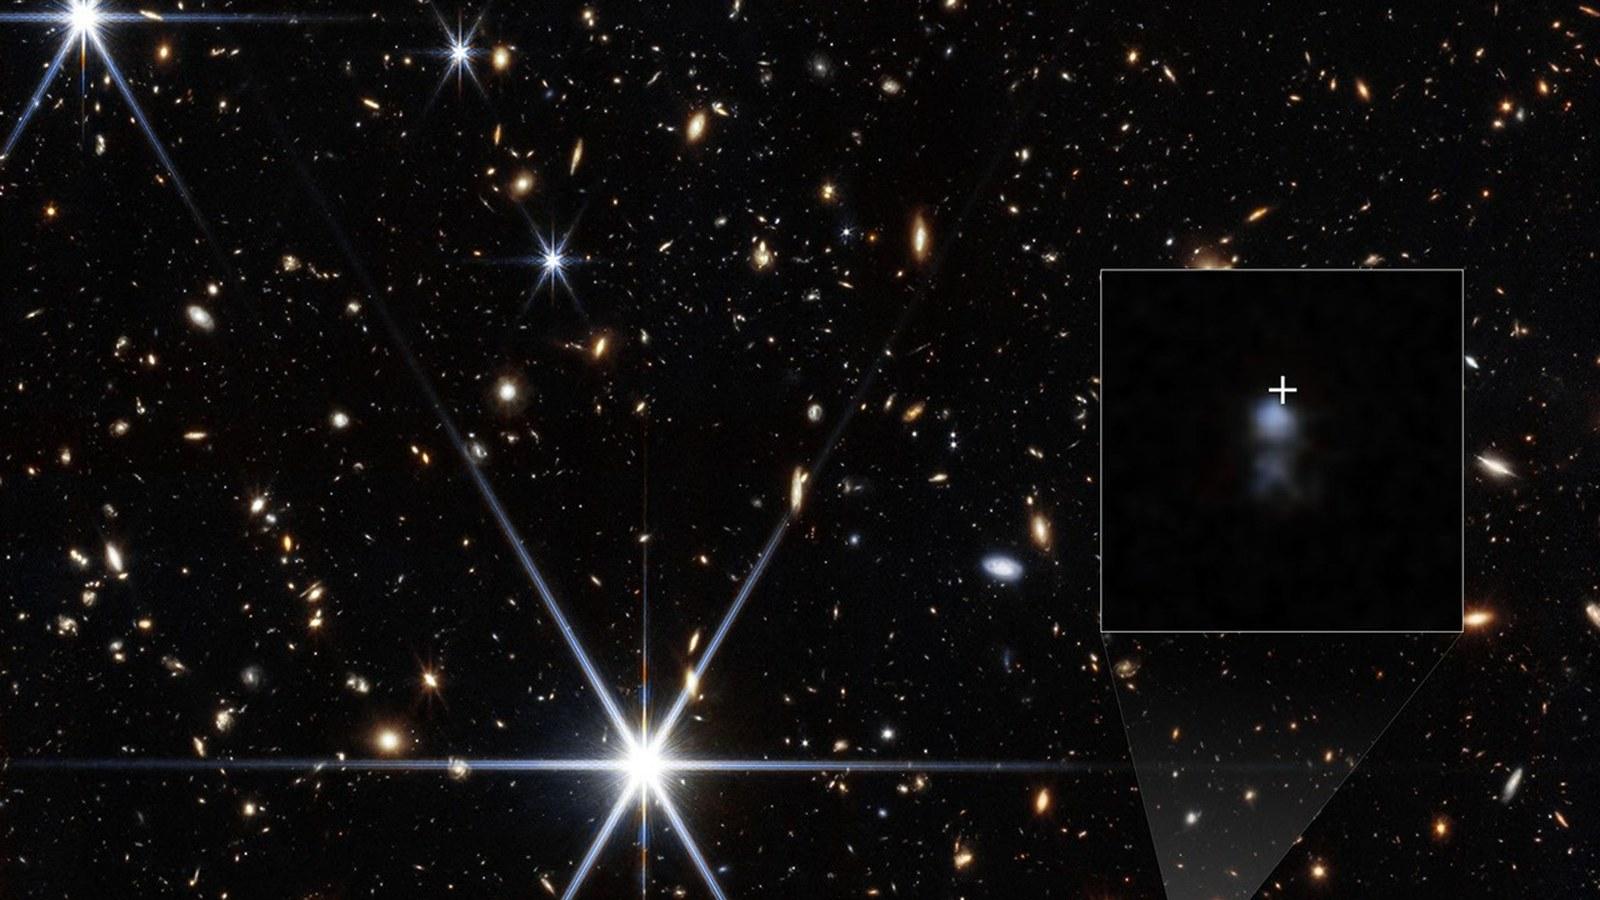
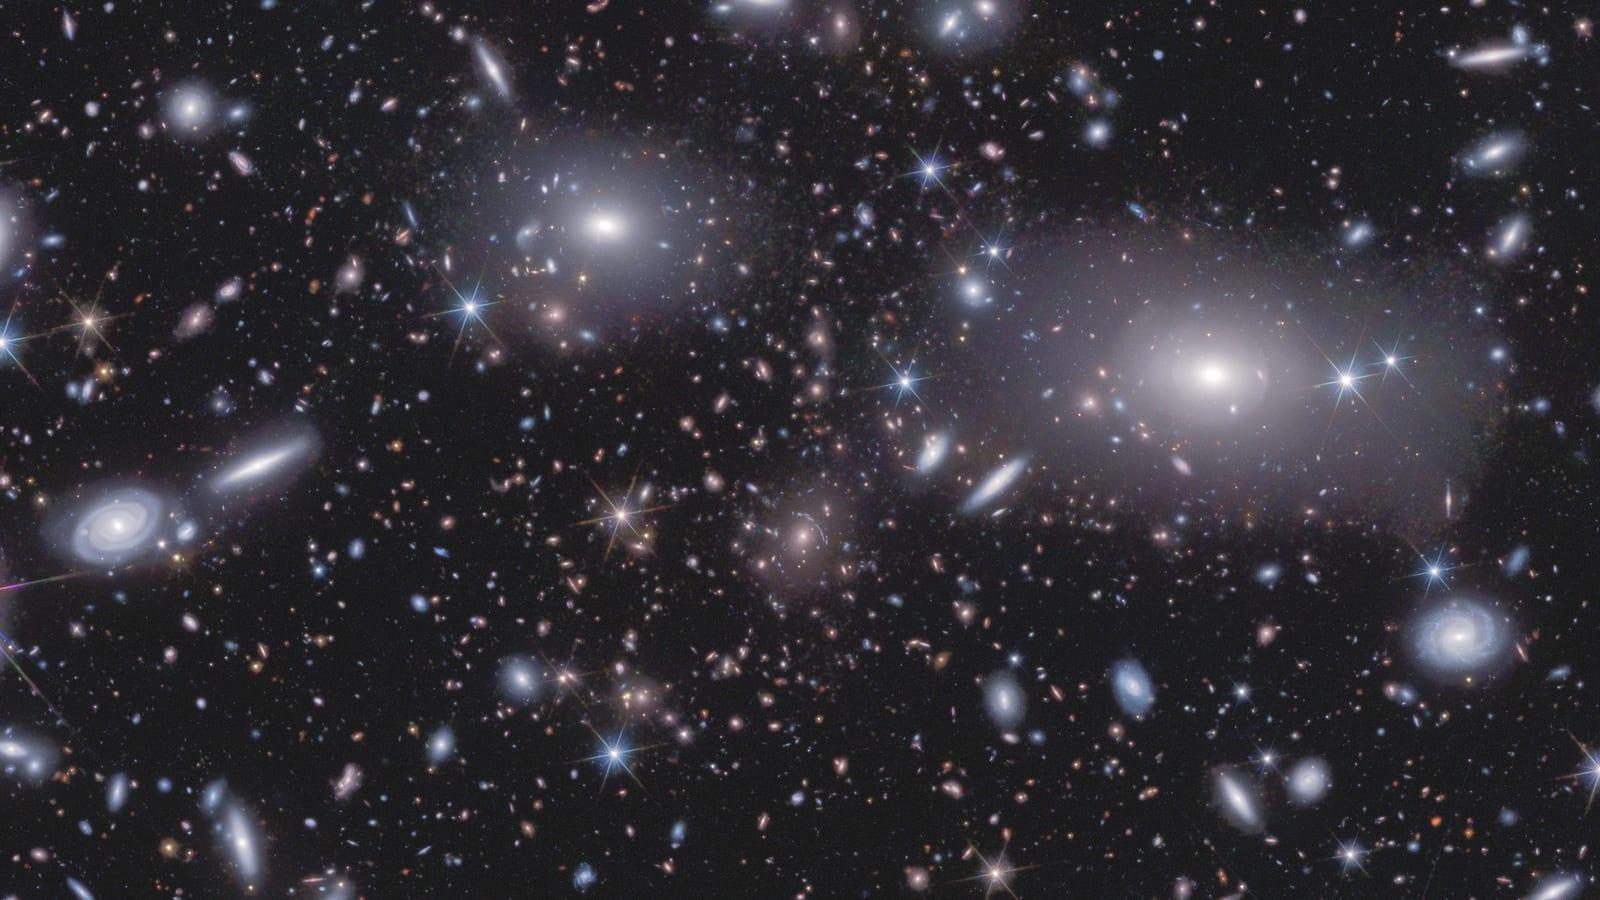
The catalogue was not built by hand. Researchers combined machine learning with help from thousands of citizen scientists through the Space Warps project, hosted on Zooniverse. Abell 3128, one of the richest clusters in the Horologium supercluster, about 800 million light-years away, hosts one of these lenses at its centre.
Images that hold their distance
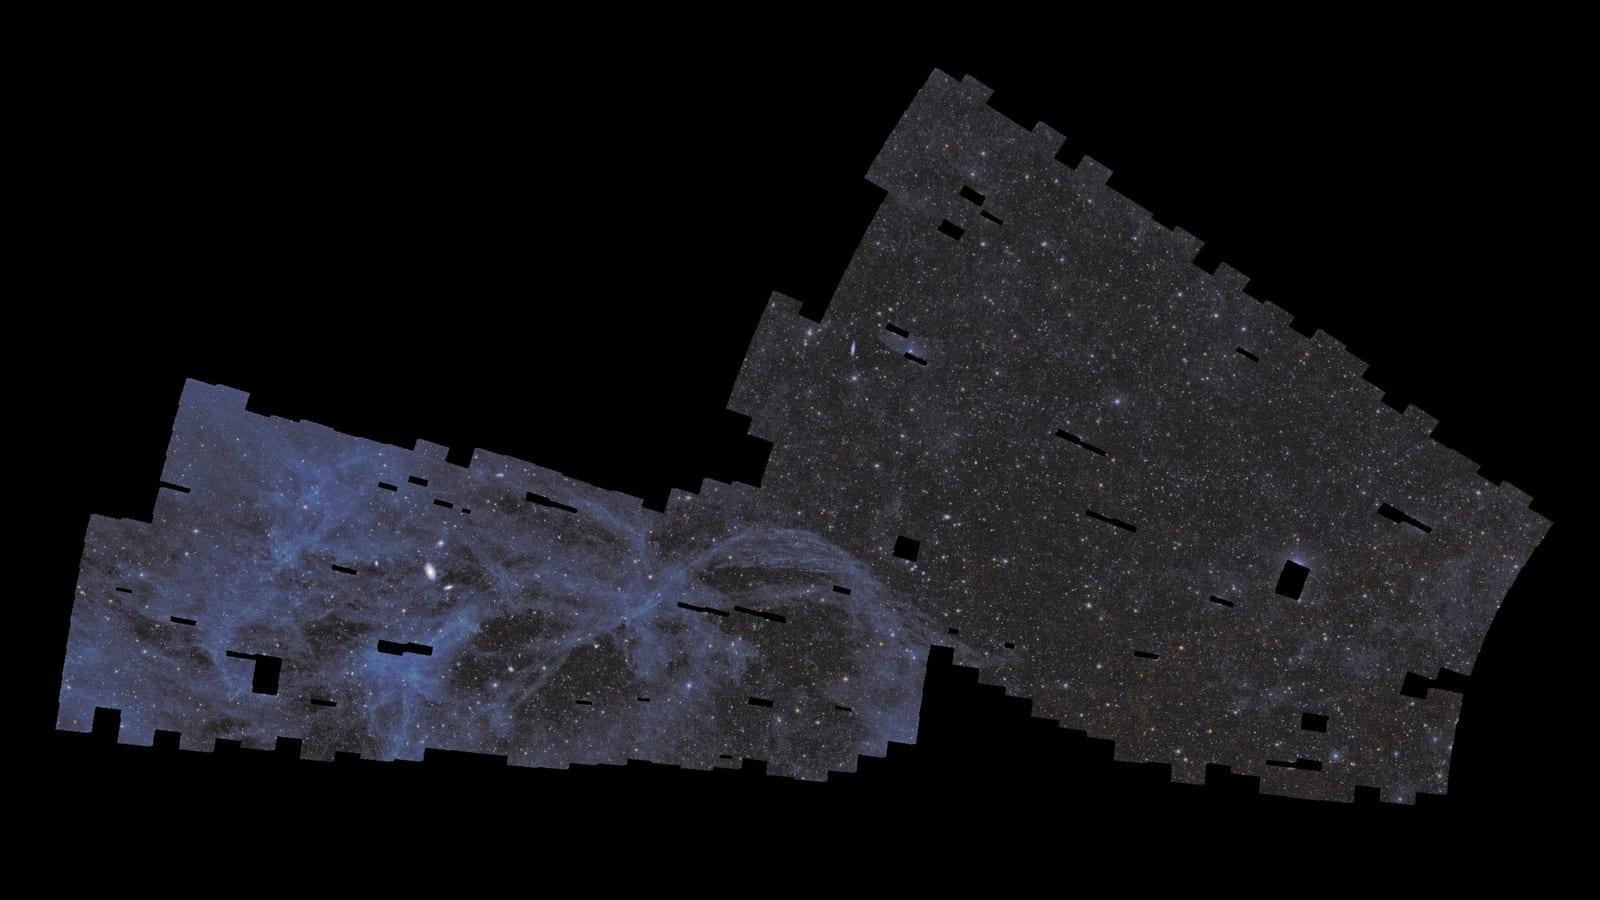
The release is not only catalogues. It also contains images, including two large mosaics. The northern one covers 367 square degrees and approaches 500 gigapixels. It rests on 740 observations. The southern one covers 148 square degrees, about 740 full Moons, and contains the Horologium supercluster, 800 million light-years away, with more than 30 galaxy clusters.
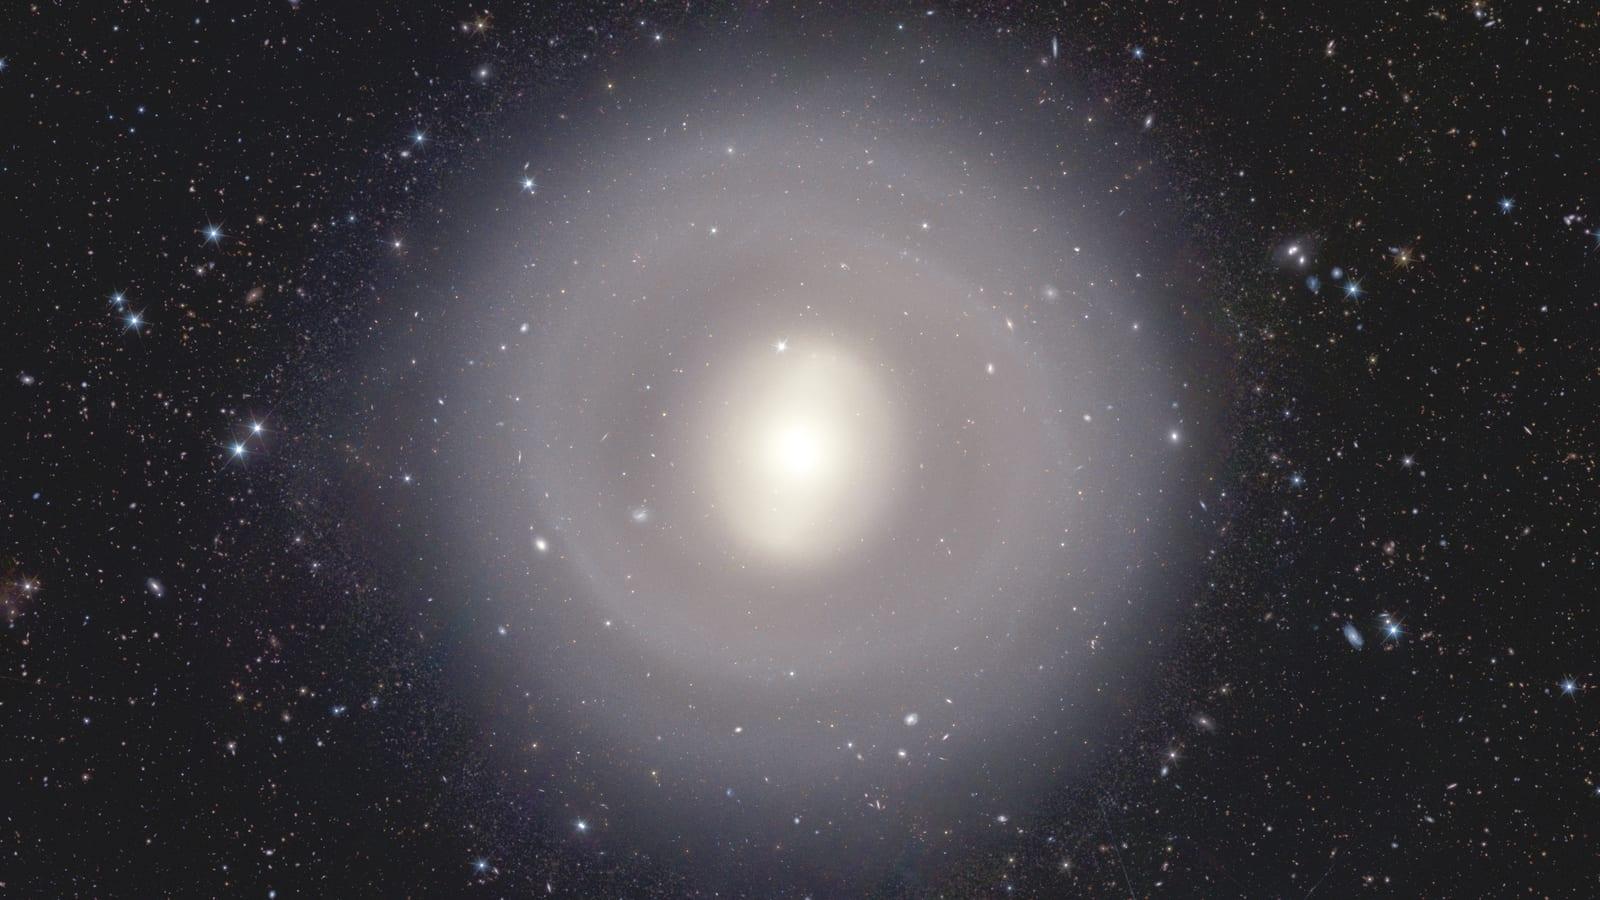
The resolution shows in the close-ups. NGC 1291, a ring galaxy about 33 million light-years away, was observed in 70 minutes over 0.11 square degrees, roughly half a full Moon. The bright core, the diffuse disc and the dark ring are sharp, and forming stars appear as small blue dots. In the same frame, more distant galaxies form a red backdrop.
What changes, and what comes next
DR1-Foundation is not the final map. It is its foundation, in the literal sense. For the first time, the release offers enough images, spectra and catalogues to begin mapping structure on a large scale. Most of the area remains to be covered, and the complete DR1 will add weak lensing, the tiny distortions that affect countless galaxies and map dark matter over enormous distances.
The end goal is ambitious. Euclid is meant to observe billions of galaxies out to 10 billion light-years, across more than a third of the sky. Behind that map sits a question: how has the expansion of the Universe changed? Observations in the 1990s showed that the expansion is accelerating, and the cause has a name, dark energy. Its nature is still unknown. By tracing structure over 10 billion years, Euclid aims to see how that acceleration took hold.
Carole Mundell, ESA's Director of Science, calls the release a scientific milestone, far beyond beautiful pictures. The consortium brings together more than 2,000 scientists at 300 institutes in 15 European countries, the United States, Canada and Japan. The data is public, distributed through the Euclid Data Space platform.
Going further
- The mission page: Euclid, for the telescope, its instruments and its six-year survey.
- The key ideas: dark matter, spectroscopy, galaxies and the L2 Lagrange point.
- For observers: the sky map helps locate the constellations that border the areas Euclid surveyed.
- The sources: ESA's release of 12 November 2026, the northern mosaic page, the wide and deep survey page, the NGC 1291 page, the Abell 3128 page, the DR1 calendar and the Euclid mission page.