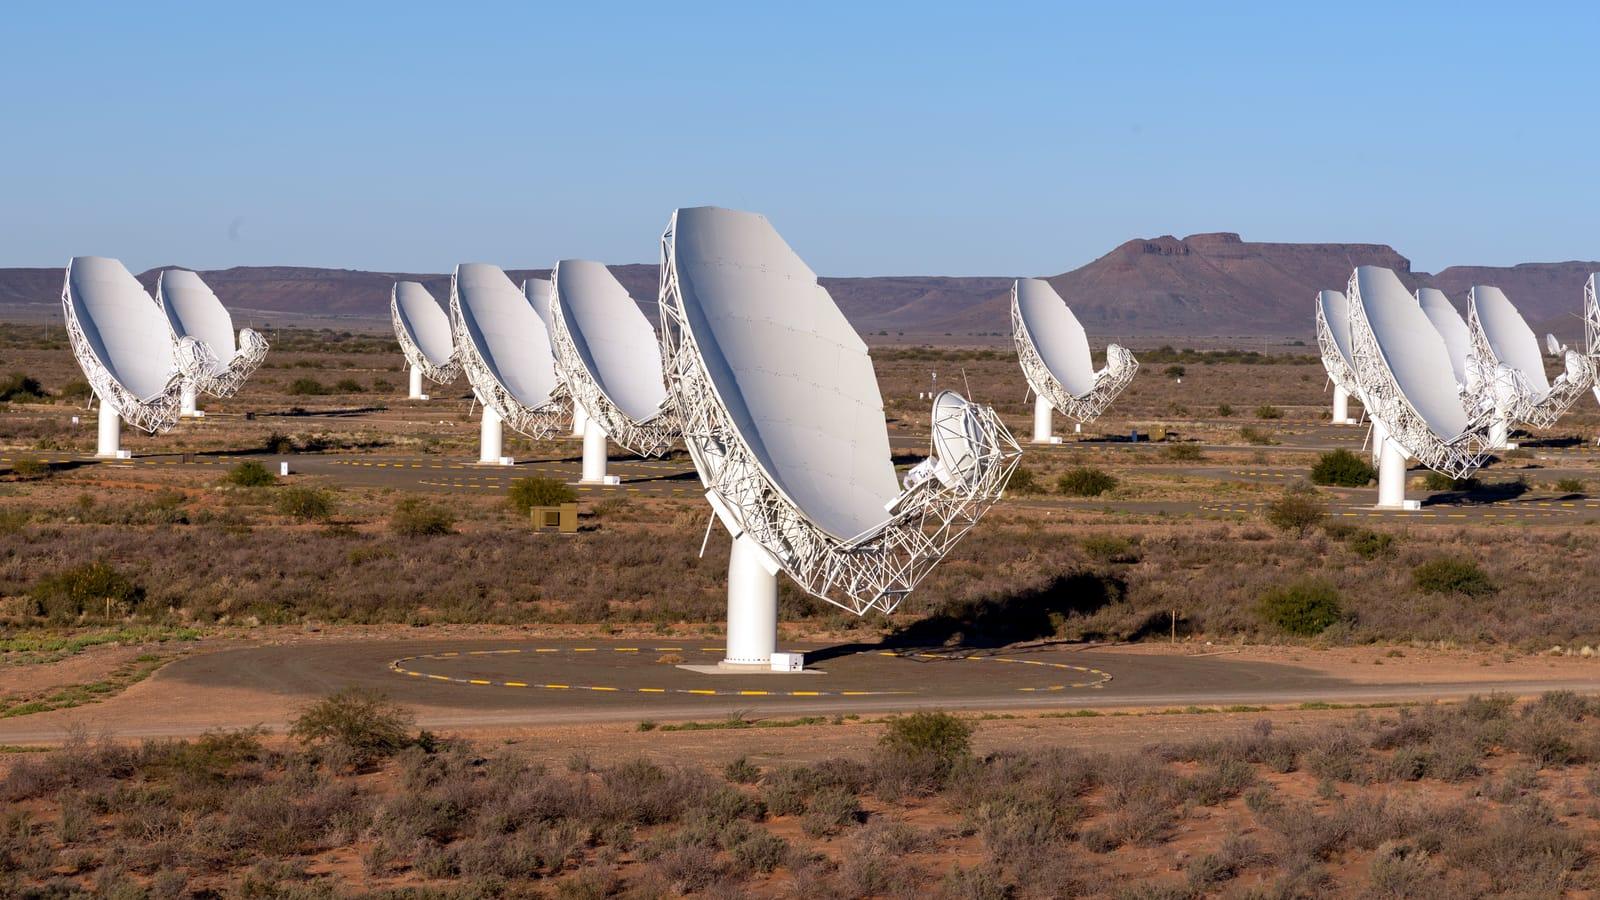
The MeerKLASS collaboration has published the first direct measurement of the large-scale distribution of neutral hydrogen in the Universe. The signal was emitted about 4.5 billion years ago. To extract it, researchers used the 64 dishes of the South African MeerKAT radio telescope, each one as an independent telescope. The detection stands at 6.2 sigma. The paper appears in Monthly Notices of the Royal Astronomical Society.
A whisper 10,000 times fainter than the sky's roar
Neutral hydrogen is the most abundant element in the Universe. It is the cold gas that feeds star formation, and it fills the space between galaxies. Its distribution traces the cosmic web, the network of filaments and voids that structures the Universe on the largest scales. Until now, cosmologists mapped that web by picking out galaxies one by one. MeerKLASS measures something else, the hydrogen emission itself, without going through galaxies.
The signal comes from far away. Its redshift is 0.42. Redshift measures how much the expansion of the Universe has stretched the light. The longer light travels, the more its wave stretches, and the larger the redshift. A redshift of 0.42 corresponds to a signal emitted about 4.5 billion years ago, when the Universe was a little older than 9 billion years.
The difficulty comes down to one number, about 10,000. Foreground emission from galaxies, galactic gas and radio sources is about 10,000 times stronger than the hydrogen signal. The team compares the task to following a whispered conversation from the front row of a roaring rock concert. The answer comes down to one word, cross-checking. The 64 dishes produce independent maps taken at different times. The cosmic signal appears in the same place in every map. Flaws tied to one dish or one night change from map to map. By comparing the maps with each other, researchers bring out what is common and cancel the rest.
The result is a 6.2 sigma detection, in a paper published on 3 November 2026. In physics, a signal at that level is enough to claim a detection. The chance of a random noise fluctuation producing it is tiny, and that is what separates a real measurement from a coincidence.
How to hear hydrogen
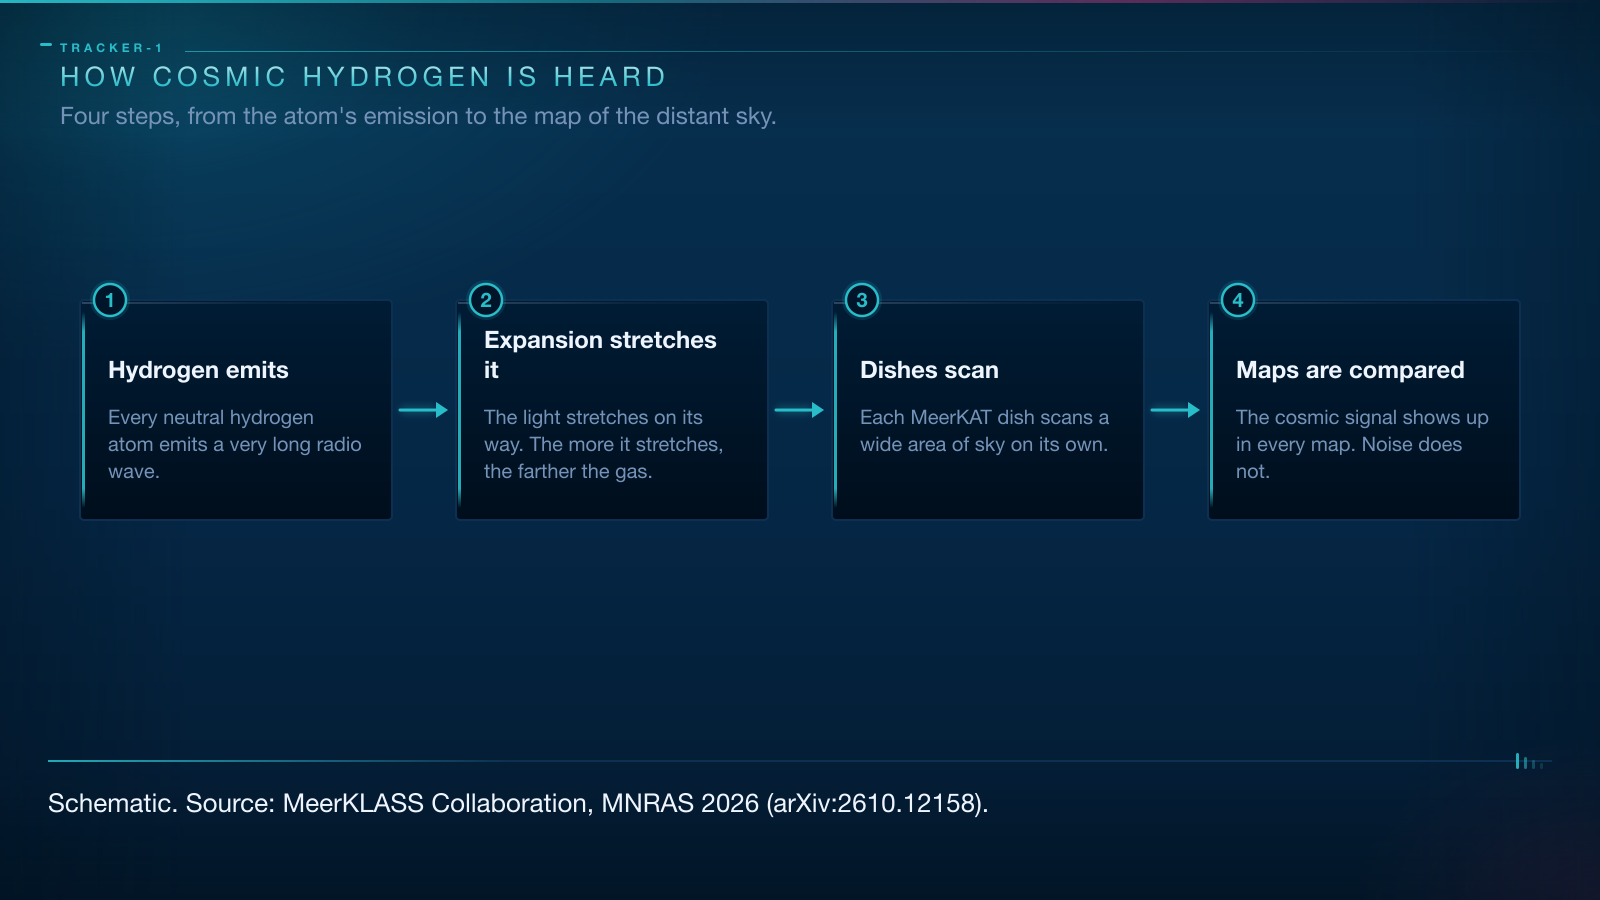
Start with an atom. Neutral hydrogen, one proton and one electron, naturally emits a very long radio wave, 21 centimetres long. Its rest frequency is 1,420 megahertz. The line is faint, but it is everywhere, because hydrogen is everywhere. As the light travels, the expansion of the Universe stretches it. Its wavelength therefore tells us when it was emitted. It is a little like recognising a familiar voice whose pitch drops as it moves away.
In the MeerKLASS data, the line arrived between 971.2 and 1,023.6 megahertz. The gap from 1,420 megahertz encodes the redshift of 0.42. To map the sky, the team did not look for individual galaxies. It measured the total intensity of the line in large pixels. The technique is called intensity mapping. It amounts to listening to the murmur of a crowd rather than to each voice, and that murmur is enough to locate the crowd.
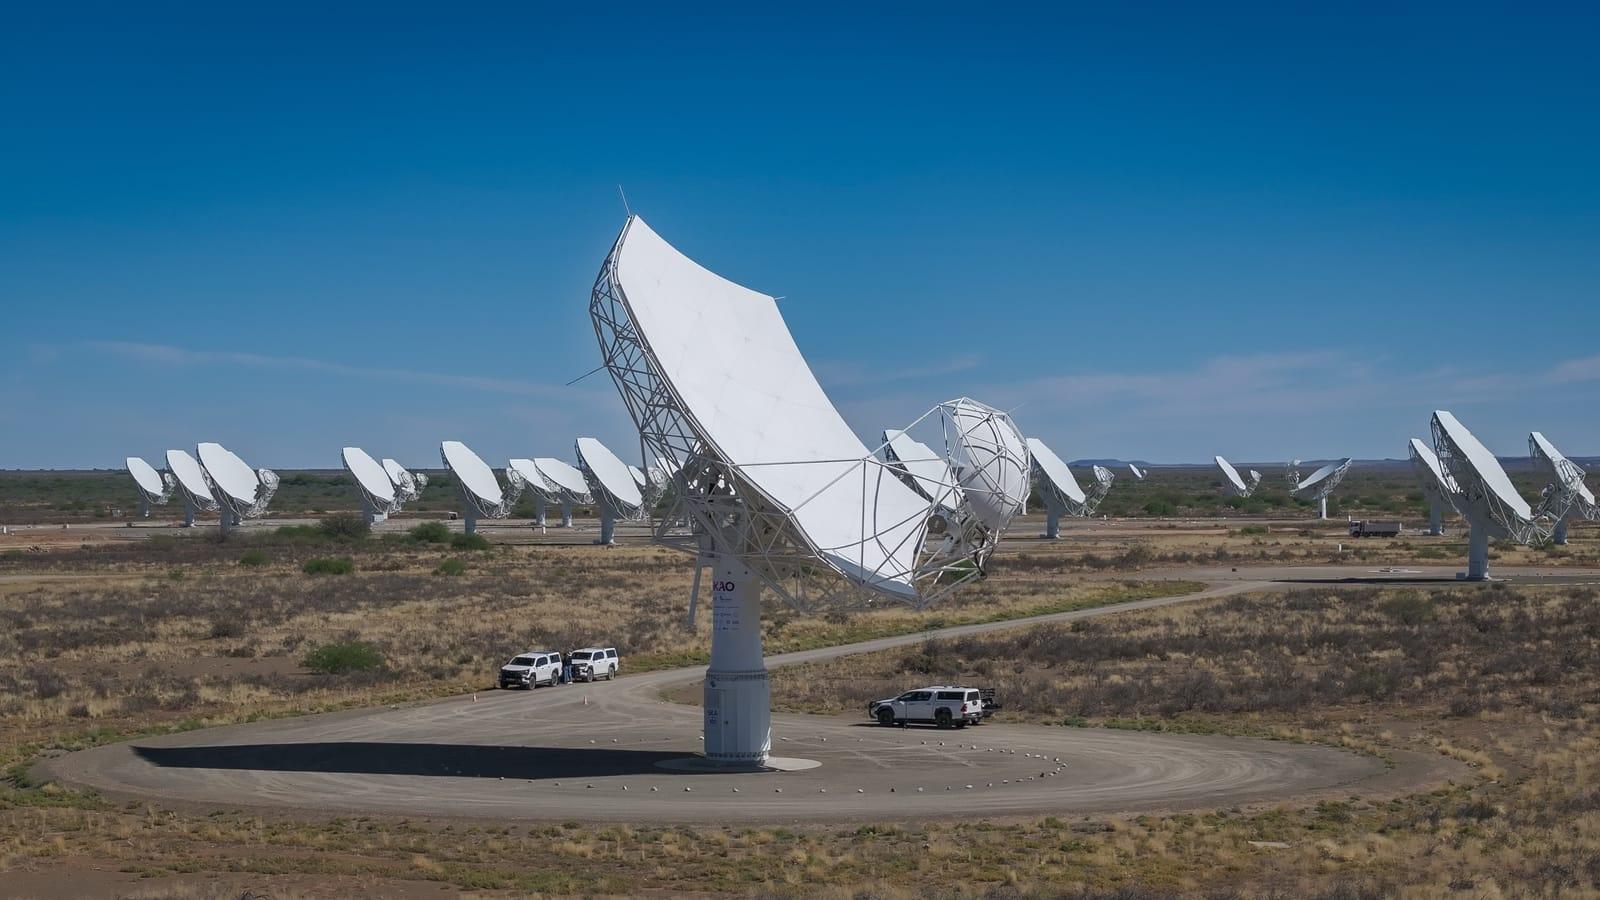
Then comes the instrument. Radio telescopes usually combine their dishes into an interferometer, a technique that makes signals interfere to produce a very sharp image. But an interferometer loses large diffuse structures, exactly the ones cosmology cares about. MeerKLASS took the opposite route. Each 13.5-metre dish scanned the sky on its own. You lose sharpness, you gain speed and access to large scales.
The 2021 campaign covered about 236 square degrees of sky, split into 41 blocks of about 1.5 hours. About 60 hours of data were kept, reduced to about 40 after radio frequency interference was filtered out. The University of Portsmouth release rounds this to 250 square degrees, roughly 1,250 times the area of the full Moon. The scientific paper keeps 236 square degrees. It is the same measurement seen at two levels of precision.
What this measurement changes
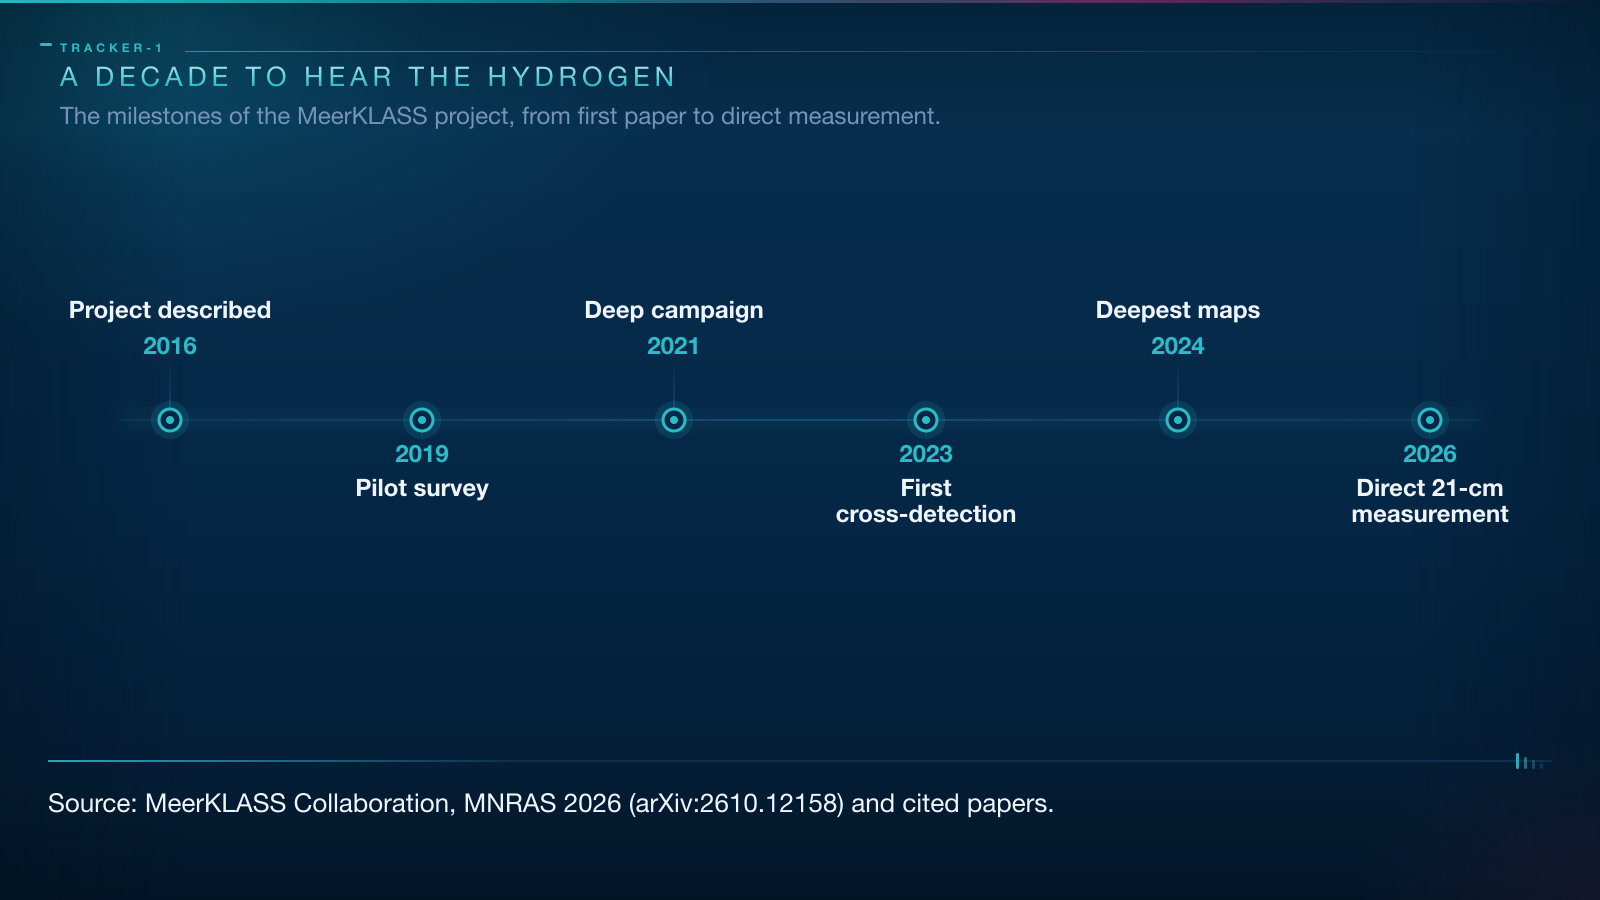
The result is more than a detection. It shows that intensity mapping works. Until now, MeerKLASS results leaned on a crutch, correlation with galaxy surveys. In 2023, matching the maps with galaxies from the WiggleZ survey produced a 7.7 sigma detection. This time, the team measures the clustering of hydrogen alone, with no galaxies as a guide. That is what the word direct means.
In the long run, the technique should map the history of cosmic expansion. Dark energy, the mysterious component that accelerates expansion, and the Hubble constant, which measures the current expansion rate, are among the biggest puzzles in cosmology. Hydrogen maps can constrain them by tracing the structure of the Universe at different epochs. A 2026 forecast shows the scale of the stakes. Combined with gravitational waves, intensity mapping cuts the uncertainty on the Hubble constant by 61% for MeerKLASS and by 53% for the future SKA-Mid, the South African part of the giant SKA radio telescope. That is not a measurement yet, it is a credible goal.
MeerKAT is a precursor to that telescope. The same method, applied to wider surveys, should reach further back in time. The collaboration brings together researchers from seven countries on three continents, and it has been working on this project for a decade. Mário Santos, its principal investigator at the University of the Western Cape, sees the result as a milestone that establishes 21-cm intensity mapping as a cosmology tool. Other instruments follow the same path, such as ESA's Euclid space telescope, which maps cosmic expansion through the light of galaxies.
Going further
- MeerKAT and the future SKA on our radio telescopes page.
- The scientific paper in Monthly Notices of the Royal Astronomical Society, and its arXiv version.
- The University of Portsmouth release, with quotes from Steven Cunnington and Mário Santos.
- The ideas to keep in mind: the interferometer, the spectroscopy that measures redshift, and dark matter, which shapes the same scales.
- Another story where cosmology turns on ever more precise measurements: our article on supernovae and dark energy.