Can you talk about weather on a world spinning 20 light-years away? On September 16, 2026, a team at Trinity College Dublin answered yes and published the recipe in Astronomy & Astrophysics. By applying a principal component analysis to three hours of James Webb observations, the researchers reduced the brightness swings of brown dwarf SIMP 0136 to two processes and three weather states that return on every rotation.
Three hours to decode thousands of rainbows
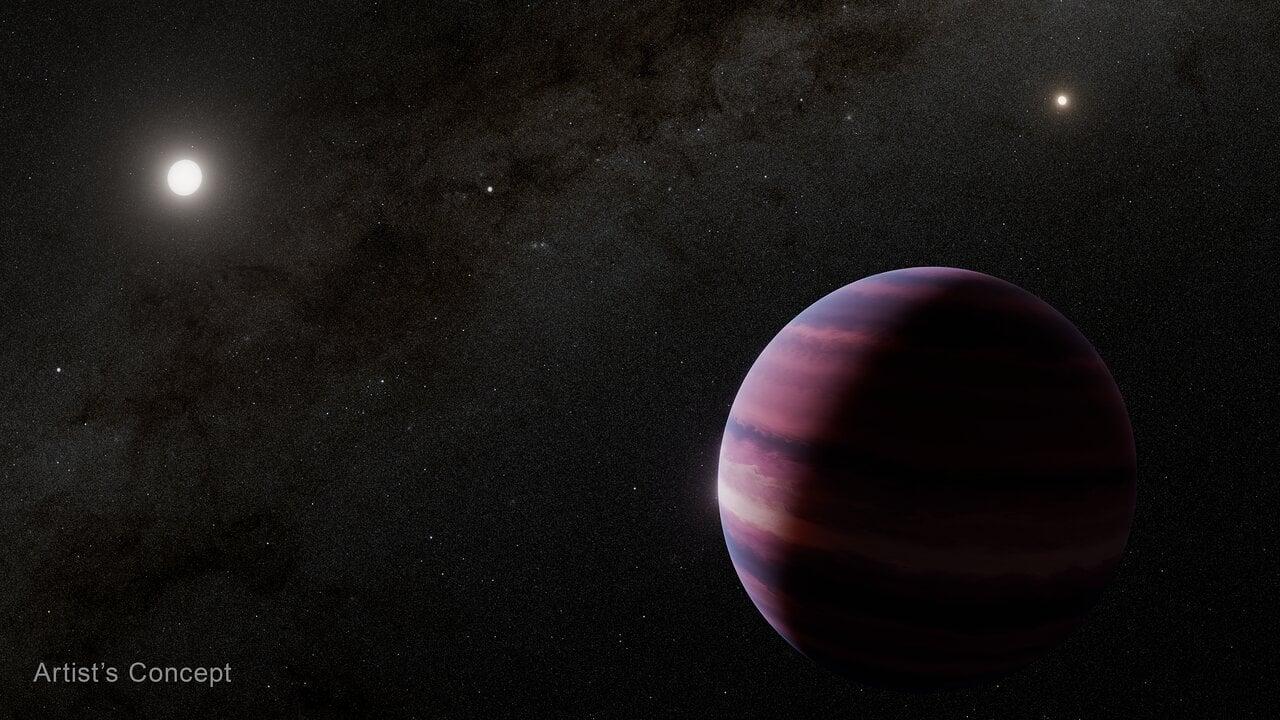
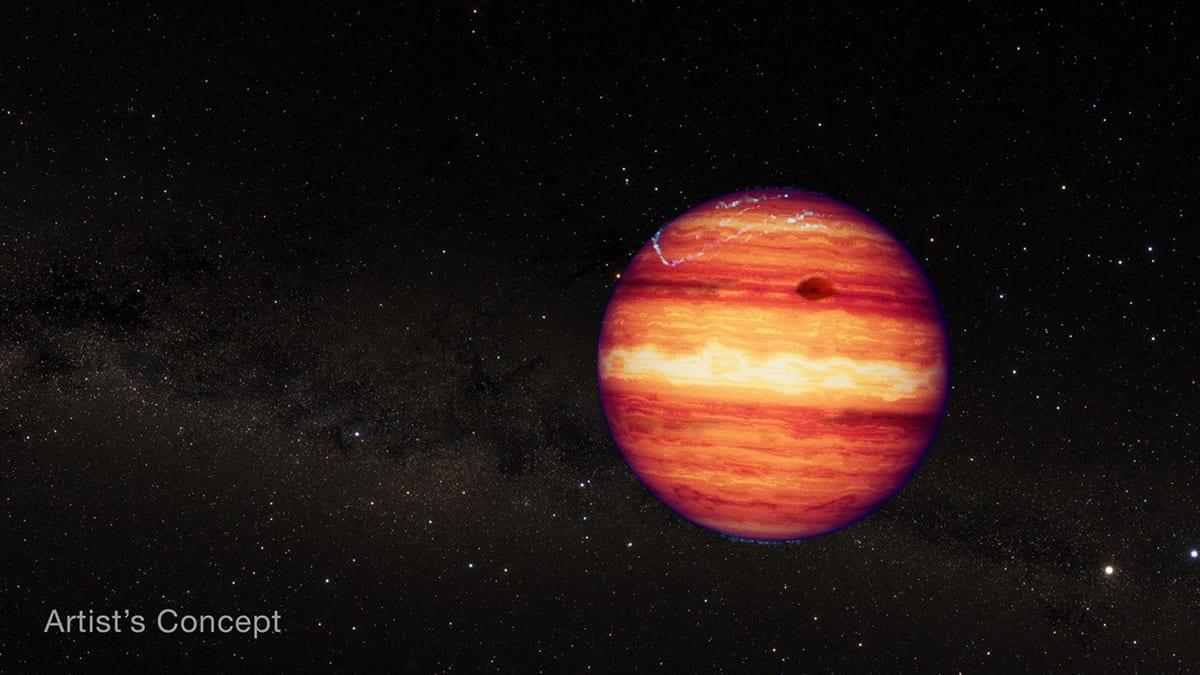
SIMP 0136 sits about 20 light-years away, in the constellation Pisces. It is the brightest isolated brown dwarf in the northern sky, and that detail changes everything for astronomers. A brown dwarf is heavier than a giant planet but too light to ignite hydrogen fusion in its core, the reaction that makes stars shine. SIMP 0136 packs about 13 Jupiter masses, its surface runs near 1,100 K (825 °C), and it spins on its axis in just 2.4 hours.
That last number is why it became a test bench. In under two and a half hours, the object shows every side of itself to the observer. A single night of watching is enough to go all the way around, several times over.
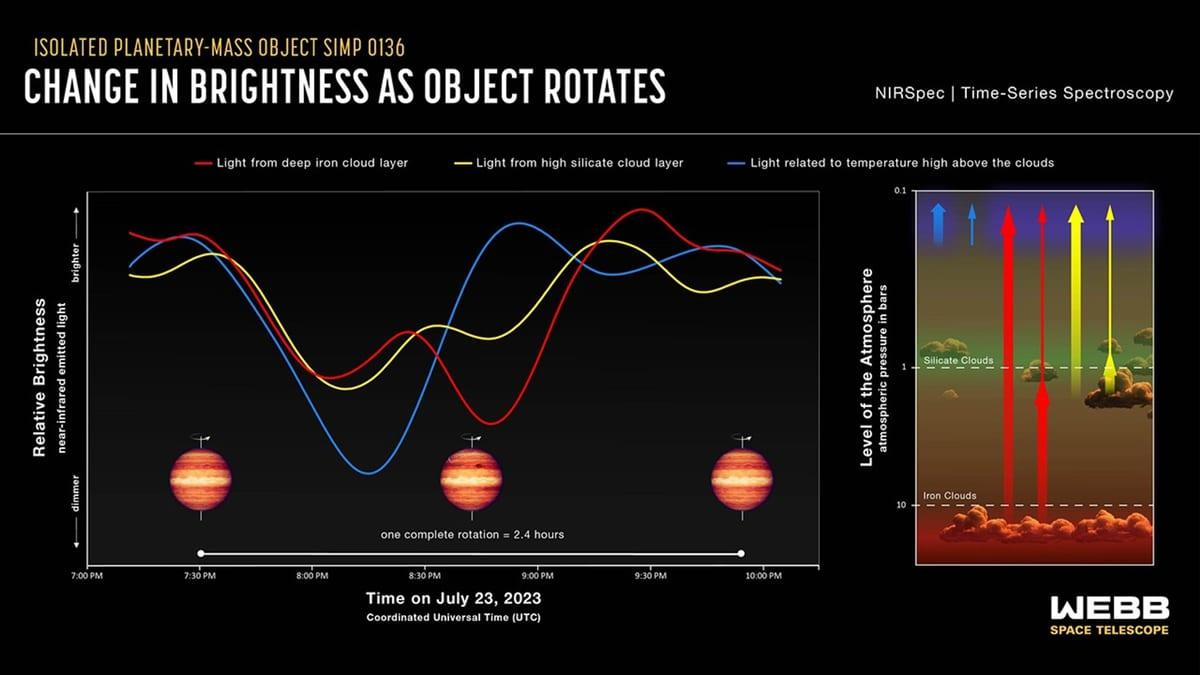
On July 23, 2023, the James Webb Space Telescope monitored SIMP 0136 for nearly three hours with NIRSpec, a spectrograph that works in the near infrared. The haul: 5,726 spectra, one every 1.8 seconds. Each spectrum is a split rainbow, and each colour carries information about one specific altitude in the atmosphere. One detail is hard to resist: the light analysed here left SIMP 0136 the year lead author Merle Schrader was born.
Sorting those thousands of rainbows by resemblance, the team saw that their changes do not scatter in every direction. They organise around just two broad patterns.
Two axes to read a whole atmosphere
The technique is called principal component analysis, and its principle is simpler than its name. Say someone plays you an orchestra recording without telling you which instruments are performing. By ear, you eventually work out that two sections alone can rebuild the whole thing: the strings, rising and falling together, and the brass, doing something else at the same time. You have not identified a single musician, but you have found the two families that move as one. The analysis does exactly this job on spectra, hunting for the few patterns that vary together, with no assumptions about the atmosphere built in.
On SIMP 0136, two patterns do the trick. Together they explain 79% of the total variation in the spectra. Better still, once those two patterns are removed, what remains matches the measurement noise almost exactly: 0.36% leftover fluctuation against 0.37% expected noise. Nothing coherent is left. A third pattern would add nothing.
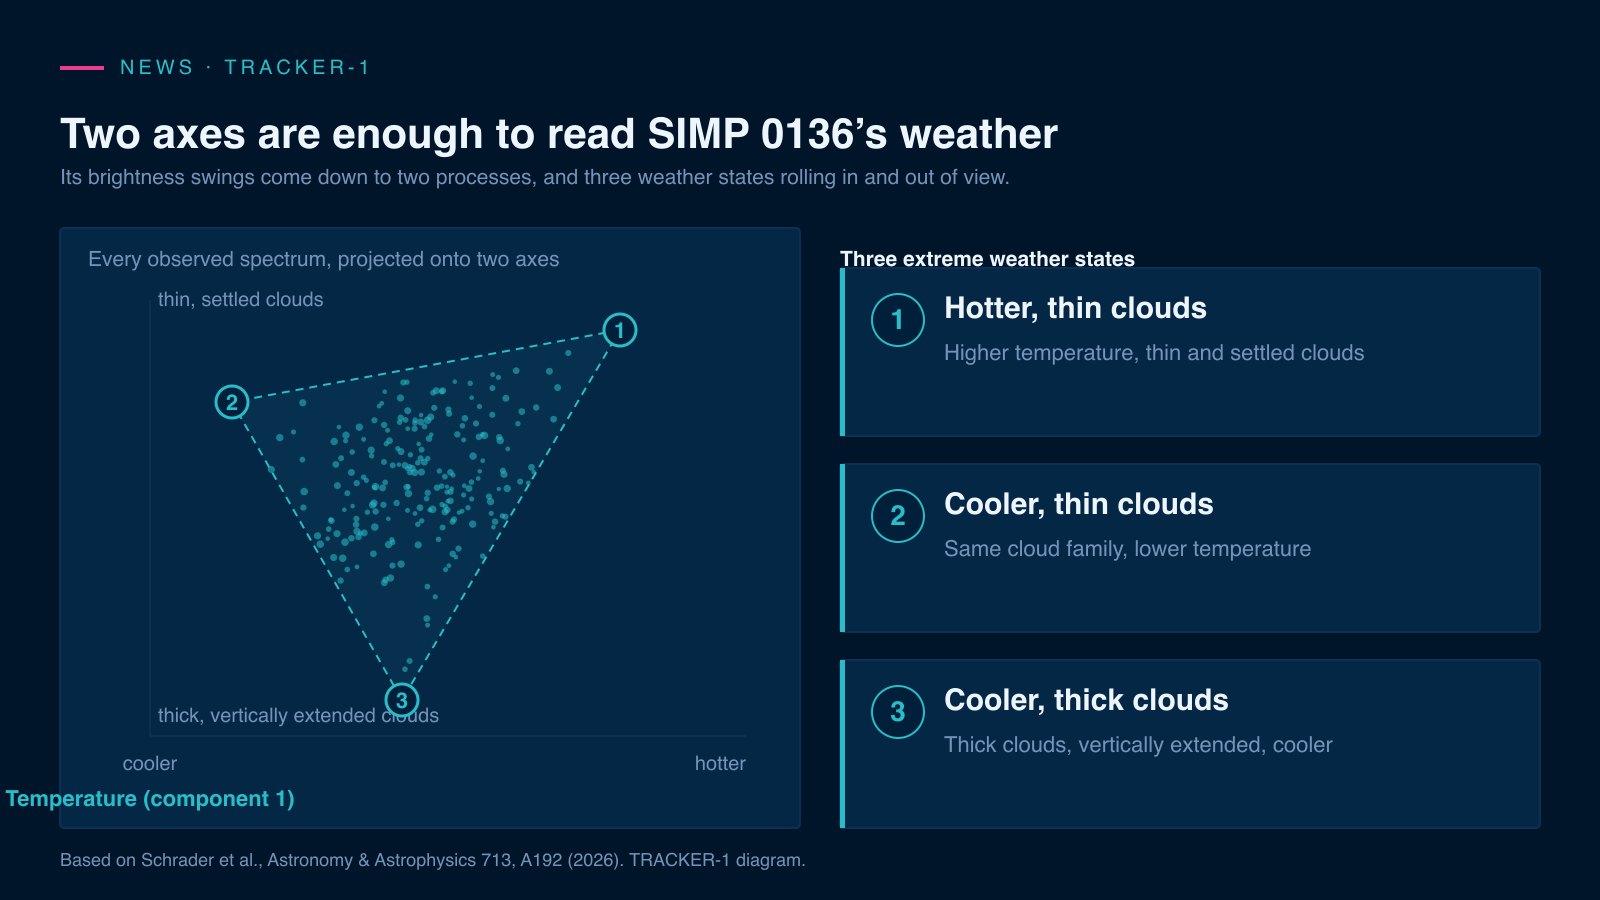
Then comes the step that turns patterns into physics, and it is an elegant one. The first pattern lifts and lowers the entire spectrum at once, like a dimmer switch. That is the fingerprint of a temperature change. The second pattern touches only certain molecular bands, the ones that depend on how high the clouds sit. That is the fingerprint of a shifting vertical structure. Two processes, then, and only two: temperature and cloud thickness.
Three weather states rolling in and out of view
SIMP 0136 is tilted about 80° to our line of sight, so we see it almost equator-on. The light reaching us at any moment is therefore a blend of the regions currently on its surface. Once the two patterns are known, the geometry of that blend appears on a simple drawing: two axes define a plane, and inside that plane every observed spectrum lands within a triangle. The three corners of the triangle are the three extreme ingredients.
First corner: a hotter region with thin, settled clouds. Second corner: a cooler region with the same family of thin clouds. Third corner: a region about as cool as the second, but wrapped in thick clouds that reach far upward. The whole weather of SIMP 0136 plays out as a continuous shift in the proportions of these three recipes.
The proportions change with longitude. When one region dominates the visible disk, its spectrum tints the total light. Then it swings around the far side and another takes over. That parade produces precisely the out-of-step curves NIRSpec recorded, without any ingredient ever vanishing completely.
A steady weather, not chaos
The most reassuring part is not the number of states. An atmosphere this restless could have been reshuffled at random from one rotation to the next. That is not what the data show.
Thirty-seven hours before the NIRSpec sequence, Webb had already observed SIMP 0136 with another instrument, NIRISS. A separate team analysed that rotation on its own and recovered the same two drivers, with two components explaining 81% of the variation. Two instruments, two independent data reductions, two observations about fifteen rotations apart: the same two processes come back. "These drivers of the weather patterns persist over time, even as the detailed appearance of the atmosphere evolves over more than a dozen rotations," confirms Merle Schrader.
The result also resolves an old puzzle. Campaigns with Hubble and Spitzer had measured surprising phase offsets between light curves, up to 180°. Those offsets fall out naturally if each colour blends the two dominant processes differently, with no need to picture a single atmospheric feature drifting out of sync. The apparent mess was a projection effect.
Earlier analyses of the same data had also flagged hot spots and a 250 K temperature inversion high in the atmosphere, possibly powered by an aurora. This new reading does not contradict them. It shows they carry less weight than the two main drivers.
Extreme Jupiters as rehearsals for habitable worlds
Brown dwarfs share their size and make-up with giant planets, and they hold one huge advantage: they shine on their own. A giant planet orbiting a star is lost in its host's glare, whereas an isolated brown dwarf can be observed directly, with no stray light to fight. That is why they work as test benches for ideas about cloud formation, air circulation and heat transport under extreme conditions.
SIMP 0136 is exactly that: a Jupiter pushed to the extreme, with planet-sized cloud systems that rearrange themselves in a matter of hours.
The method also promises a welcome shortcut. Principal component analysis pulls out the dominant processes without assuming anything about the atmosphere, and it does so fast. It serves as a first pass before the heavy models, the ones that compute an atmosphere layer by layer and tie up weeks of computing time. "Our findings will transform how astronomers analyse future JWST observations," sums up Johanna Vos, associate professor at Trinity and the team's lead.
The link to the search for life runs through here. Judging whether a planet could host life means understanding its atmosphere and its chemistry. Decoding a world's weather is how you measure the make-up and dynamics of its air. The giant planets that the Roman Space Telescope will begin imaging directly from 2027 stand to inherit these methods.
Going further
- The concepts behind the story: exoplanet, atmosphere, spectroscopy and infrared in our glossary.
- The instrument that made it possible: James Webb, and another of its harvests in our story on 27 tiny icy worlds found with Hubble.
- Want to track the weather on another world? Find Jupiter and its clouds with our interactive sky map, then plan your nights with our observing guide.
- The sources for this story: the Schrader et al. study in Astronomy & Astrophysics (September 16, 2026) and the Trinity College Dublin release.