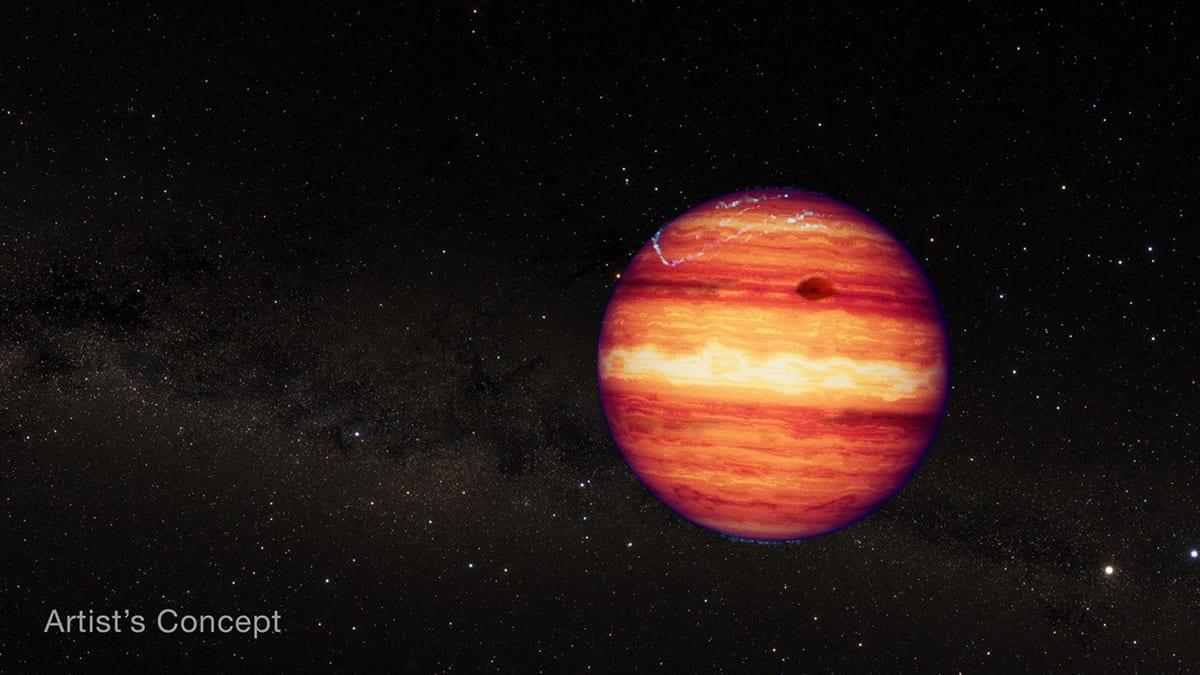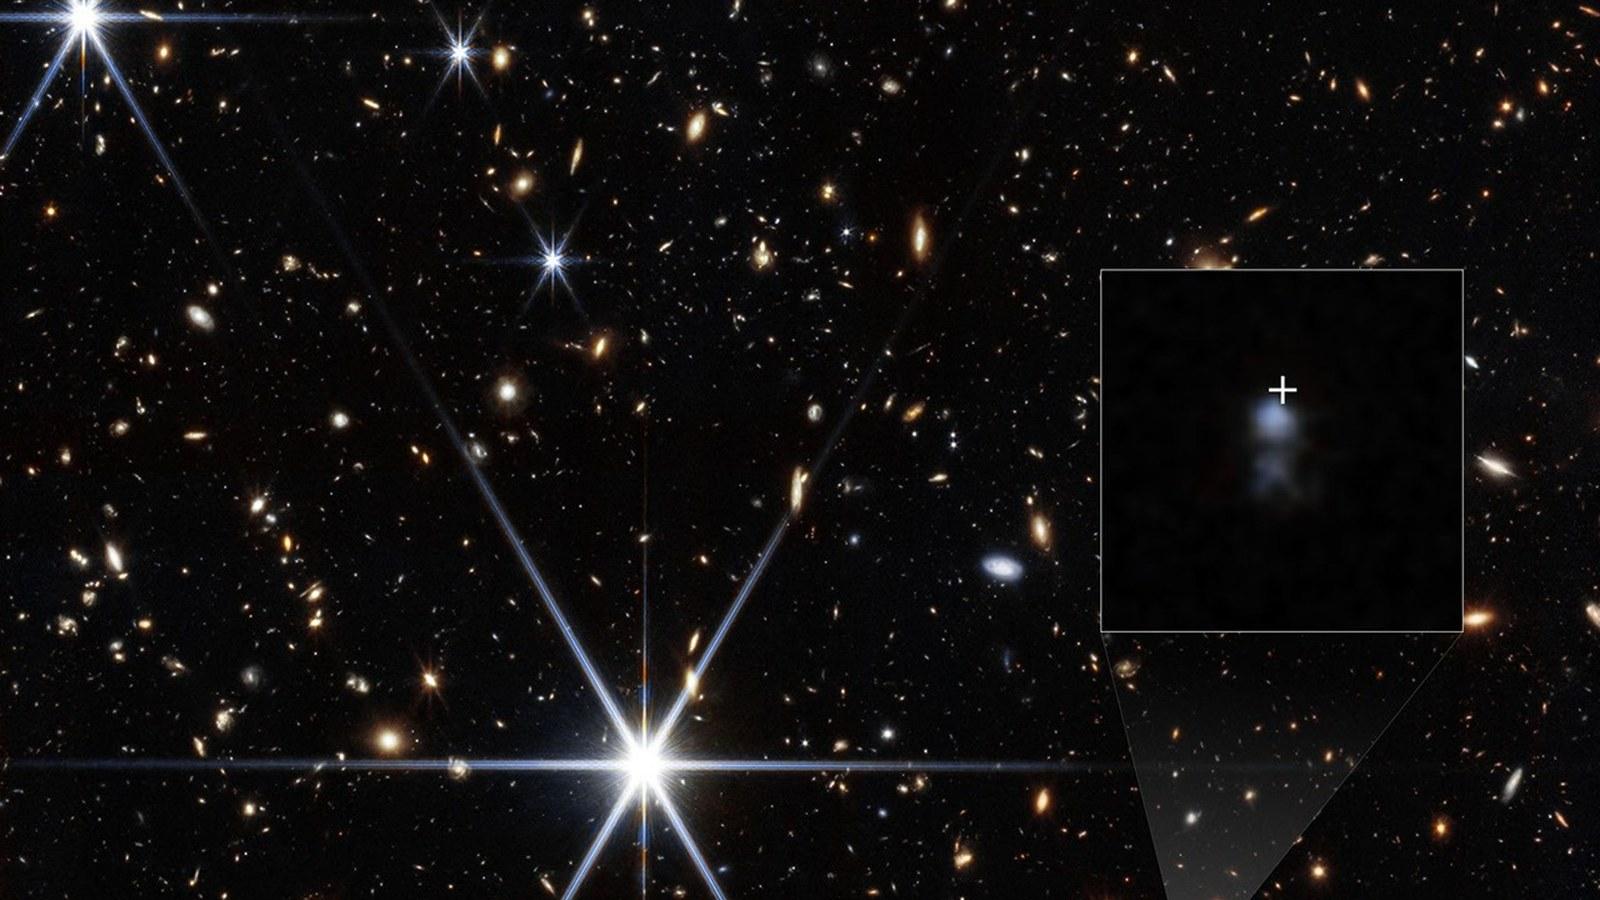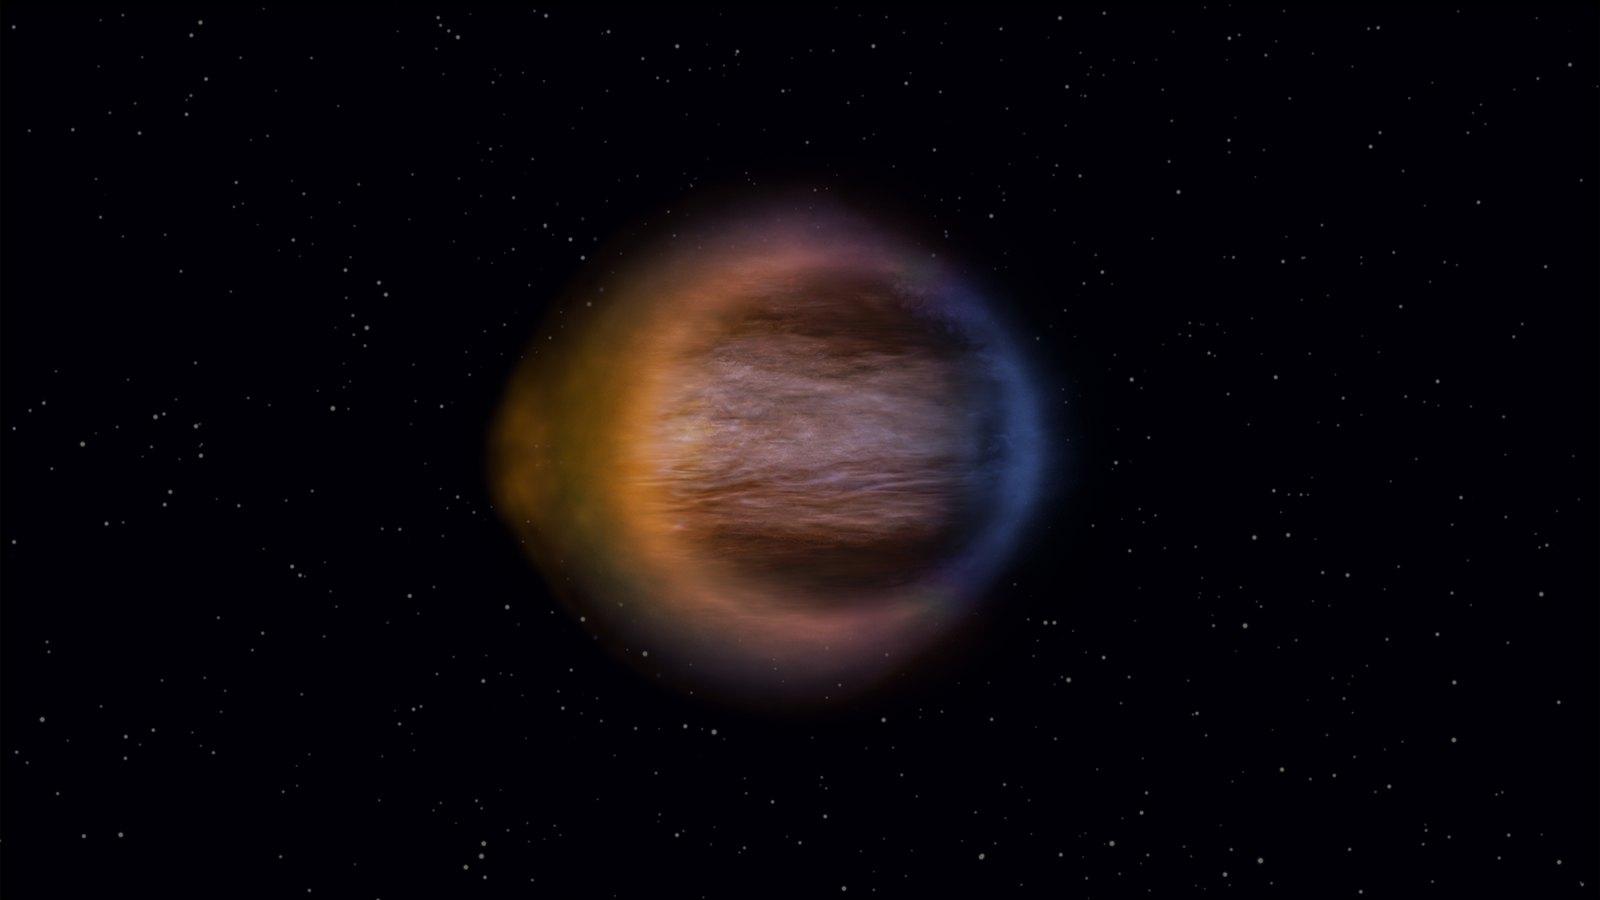
For years, exoplanet atmospheres have been drawn as rings: same thickness all the way around the disc. JWST has now dropped that shortcut. Watching the gas giant WASP-17b cross in front of its star, an international team measured its atmosphere every 20 degrees around the limb. The result is a warped ring, with a bulge on the evening side. The study appears on 14 October 2026 in Nature Astronomy.
"We've gone from a ring to understanding where on the ring the gemstones are, so to speak," says Lili Alderson of Cornell University, lead author of the study. The phrase stuck.
The evening limb is 1,195 °F hotter, and taller
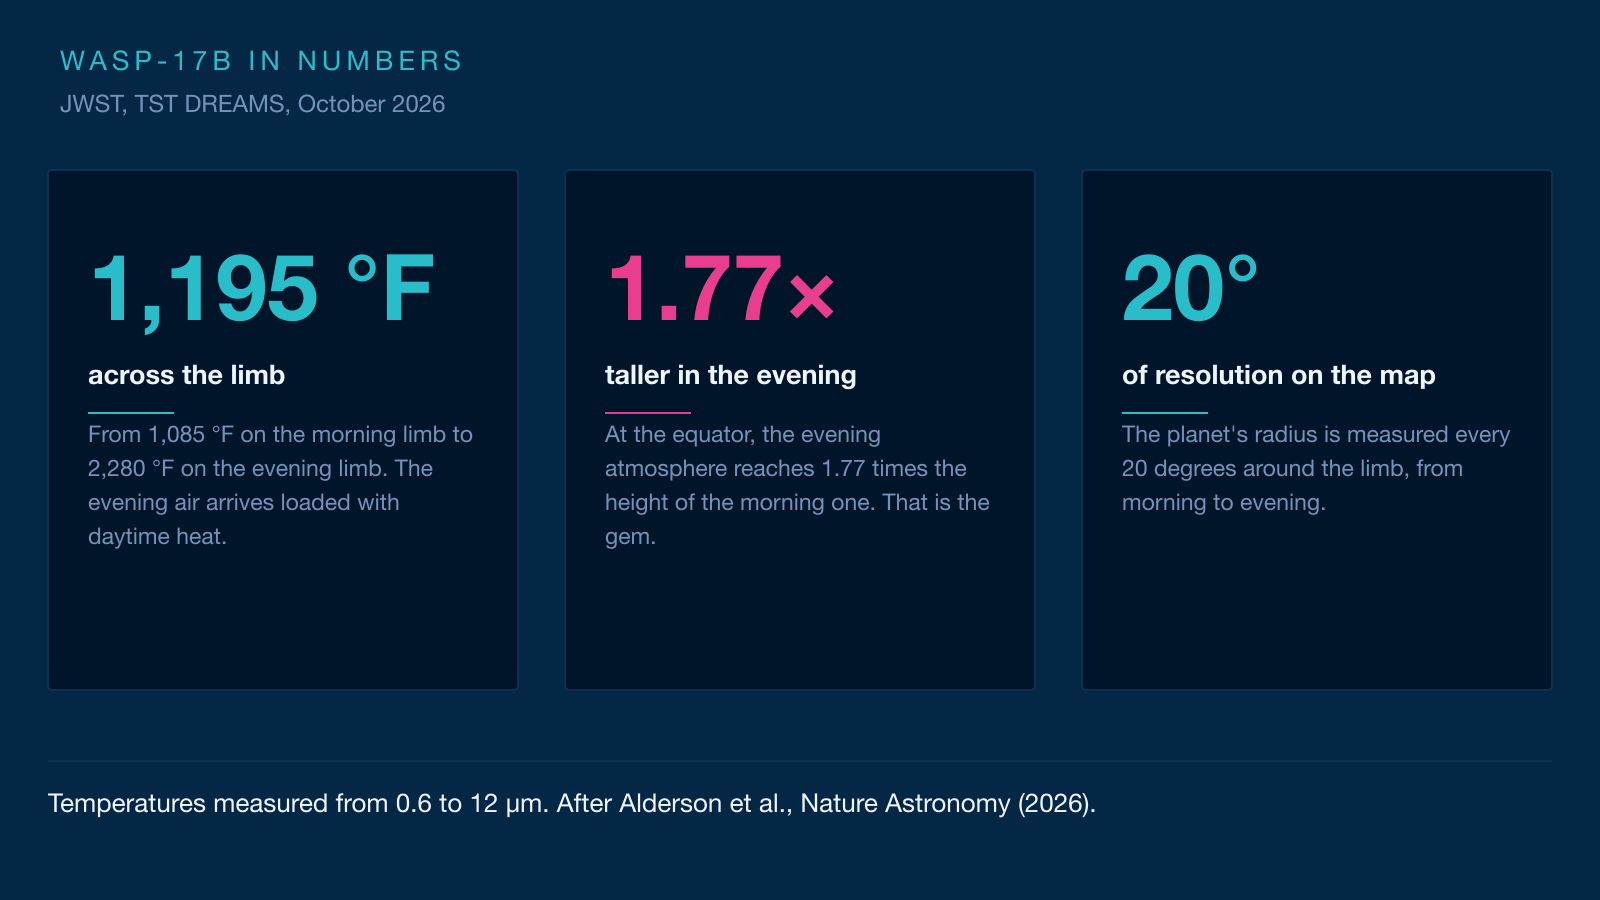
Start with the number that sums it all up. Between the morning and evening limbs of WASP-17b, the atmospheric temperature shifts by 1,195 °F. The morning side sits at 1,085 °F, about twice the top heat of a home oven set to clean itself. The evening side climbs to 2,280 °F, as hot as molten lava.
Researchers publish these values in kelvin, the unit physicists use that starts at absolute zero, minus 460 °F. So 858 kelvin equals 1,085 °F, and 1,522 kelvin equals 2,280 °F. We keep Fahrenheit here, which is easier to picture.
That gap has a visible consequence. Hot gas takes up more room than cold gas. The evening atmosphere expands, and the planet looks wider on that side. The team measured how much: the scale height of the evening atmosphere is 1.77 times that of the morning.
The most pronounced bulge sits at the equator of the evening limb. That is what the authors call a "gem", a lump sitting on the ring. It is nothing solid. It is simply the spot where warm air arrives after circling the planet.
How to trace the outline of a world you cannot see
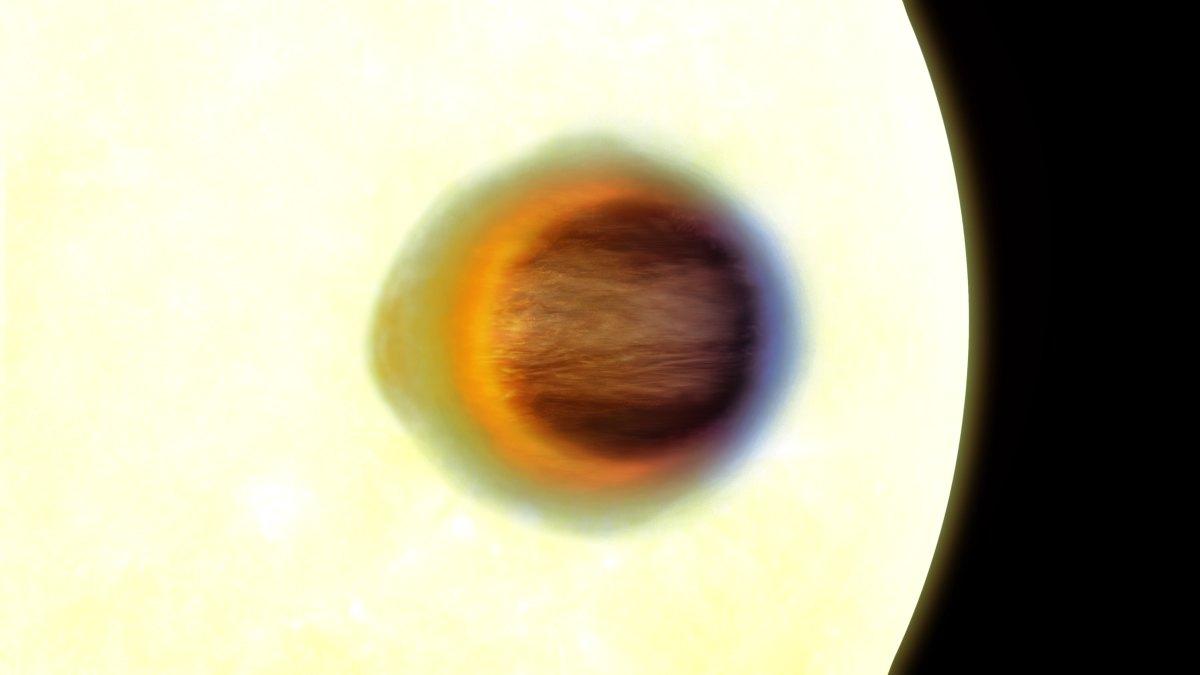
WASP-17b does not show up in any image. At 1,300 light-years, it amounts to a dip in brightness as it crosses its star. That dip, the transit, lasts a few hours and comes to about 2% of the star's glow.
During transit, some of the starlight filters through the planet's atmosphere on its way to us. The air stamps it with a signature: each molecule swallows certain colours and lets the rest through. Split that light into 24 colour slices, from 0.6 to 12 micrometres, and you get a spectrum, the chemical fingerprint of the air it crossed.
The trouble is that this spectrum blends everything together. Light grazing the morning edge, light grazing the evening edge and light passing over the pole all come out of the same funnel. Standard methods untangle this by assuming a perfect circle, which amounts to averaging different atmospheres into one.
The trick behind the new method is easy to picture. Imagine a shadow on a wall, cast by an object you cannot see. Your job is to recover its outline. A circle would always give the same width. But if you let the outline bend, like an elastic band stretched around a potato, the shadow starts to reveal its bumps.
That is what the Harmonica code does, built at Bristol by David Grant and Hannah Wakeford. For each colour, it describes the planet's radius as a Fourier series, meaning a stack of ever-finer waves added together. The first term gives a circle. Later terms carve increasingly detailed deformations, much like the sliders on a graphic equaliser shaping a sound.
Then comes the question of how far to bend before the shape stops meaning anything. A contour that is too flexible will chase the noise and invent bulges that are not there. So the team used cross-validation: they hold back part of the data, fit the shape to the rest, then check whether the model predicts the hidden part. The deformation kept is the one that predicts best, not the one that fits best.
A jet that circles the world
Why is one side hotter than the other? The answer lies in the orbit. WASP-17b completes a lap in just 3.7 days, at 0.051 astronomical units from its star, about one eighth of the distance between Mercury and the Sun.
At that range, stellar tides have stopped the planet's spin. It always shows the same face to its star, the way the Moon always shows the same face to Earth. One hemisphere sits in permanent daylight, the other in permanent night.
That setup creates an imbalance the atmosphere sets out to fix. Air on the dayside heats up, expands and rises. It then streams toward the nightside, driven by a fast jet that belts the equator. Models have predicted this super-rotating current for two decades.
The evening limb is where that flow crosses over. Air arrives there still warm, loaded with the energy it picked up on the lit face. The morning limb instead receives air that has spent days in the dark, shed its heat to space and lost volume. Hence the contrast.
One detail makes the result sturdier still. The team measured the abundance of water and carbon dioxide at every angle. Neither molecule shifts from one side to the other: the makeup of the air stays the same around the limb. Only temperature varies. That is exactly what circulation models predict, since they move heat around without stirring the chemistry much.
What it changes for exoplanet science
The result is more than a pretty map. It delivers a method and a benchmark.
The method first. It works on any transit with enough precision, and the code is open source. Exoplanet atmospheres used to be described in two blocks, day and night. They can now be cut into thin slices, the way planetary scientists do for worlds in our own solar system.
The benchmark next. WASP-17b becomes one of the few planets whose atmosphere is charted from both ends: through the limb during transit, and across the dayside during eclipse. Both measurements tell the same story. The planet runs hot where winds deposit heat, and cold where they have carried it away.
The numbers also place WASP-17b within a family. Contrasts measured on other hot Jupiters ranged from 180 °F on WASP-107b to 504 °F on WASP-94A b. At 1,195 °F, WASP-17b is the most extreme of the set. It is also the hottest of the series, as models expected.
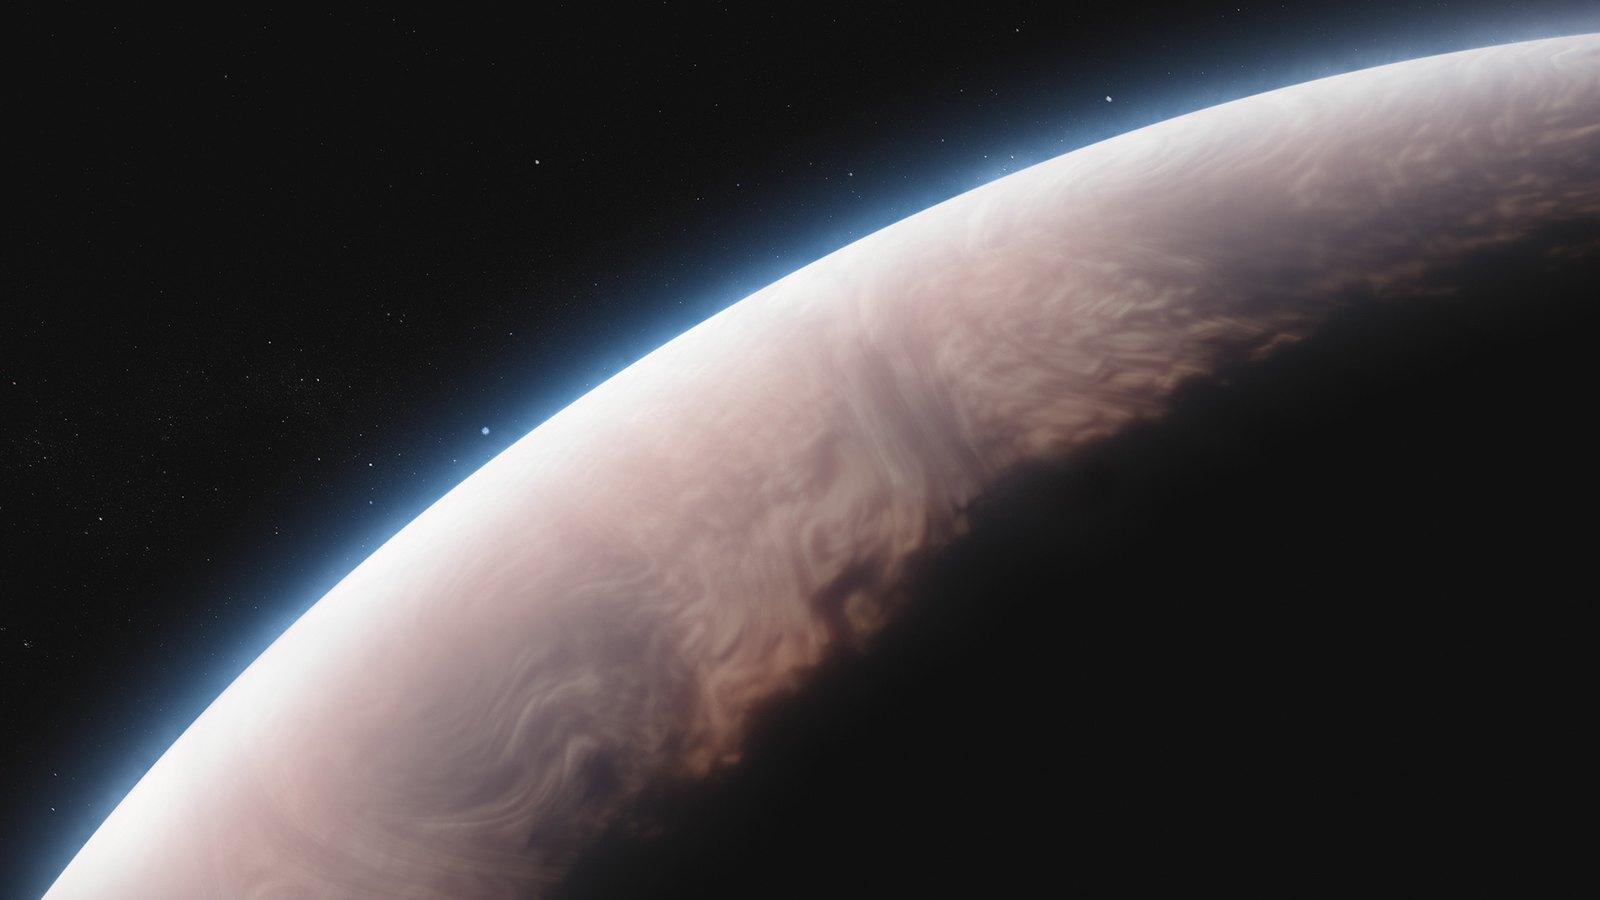
"Planets are temperamental, their atmospheres complex and chaotic," says Hannah Wakeford, co-author and professor at Bristol. "The fact that all of these numbers came together and showed us this very structured, dynamical picture of this giant world over 1,000 light-years away was just really exciting."
The team is clear about the limits. The map assumes symmetry between the northern and southern hemispheres, which simplifies the computing. The spectra are also coarser than those from standard methods, with a transit-depth precision of about 120 parts per million. Upcoming mid-infrared observations should sharpen the far end of the spectrum.
Going further
- The concepts behind the story: exoplanet, atmosphere, transit, spectroscopy and infrared in our glossary.
- The instrument that made the measurement possible: James Webb. Another of its atmospheric reads is told in our article on the weather of the brown dwarf SIMP 0136.
- Another hot Jupiter from the same programme: our article on the first wake of a protoplanet in its disc.
- Fancy a look at Jupiter, the closest analogue to these worlds? Find it with our interactive sky map, plan your evening with our observing guide, and compare with the images in our astrophotography gallery.
- The sources for this article: the Alderson et al. study in Nature Astronomy (14 October 2026), its arXiv version and the University of Bristol press release.